
proPilot 4.12.0 is here, welcome to an even more powerful experience!
Let's explore together the new features that will allow you to reconnect strategy with achievements!

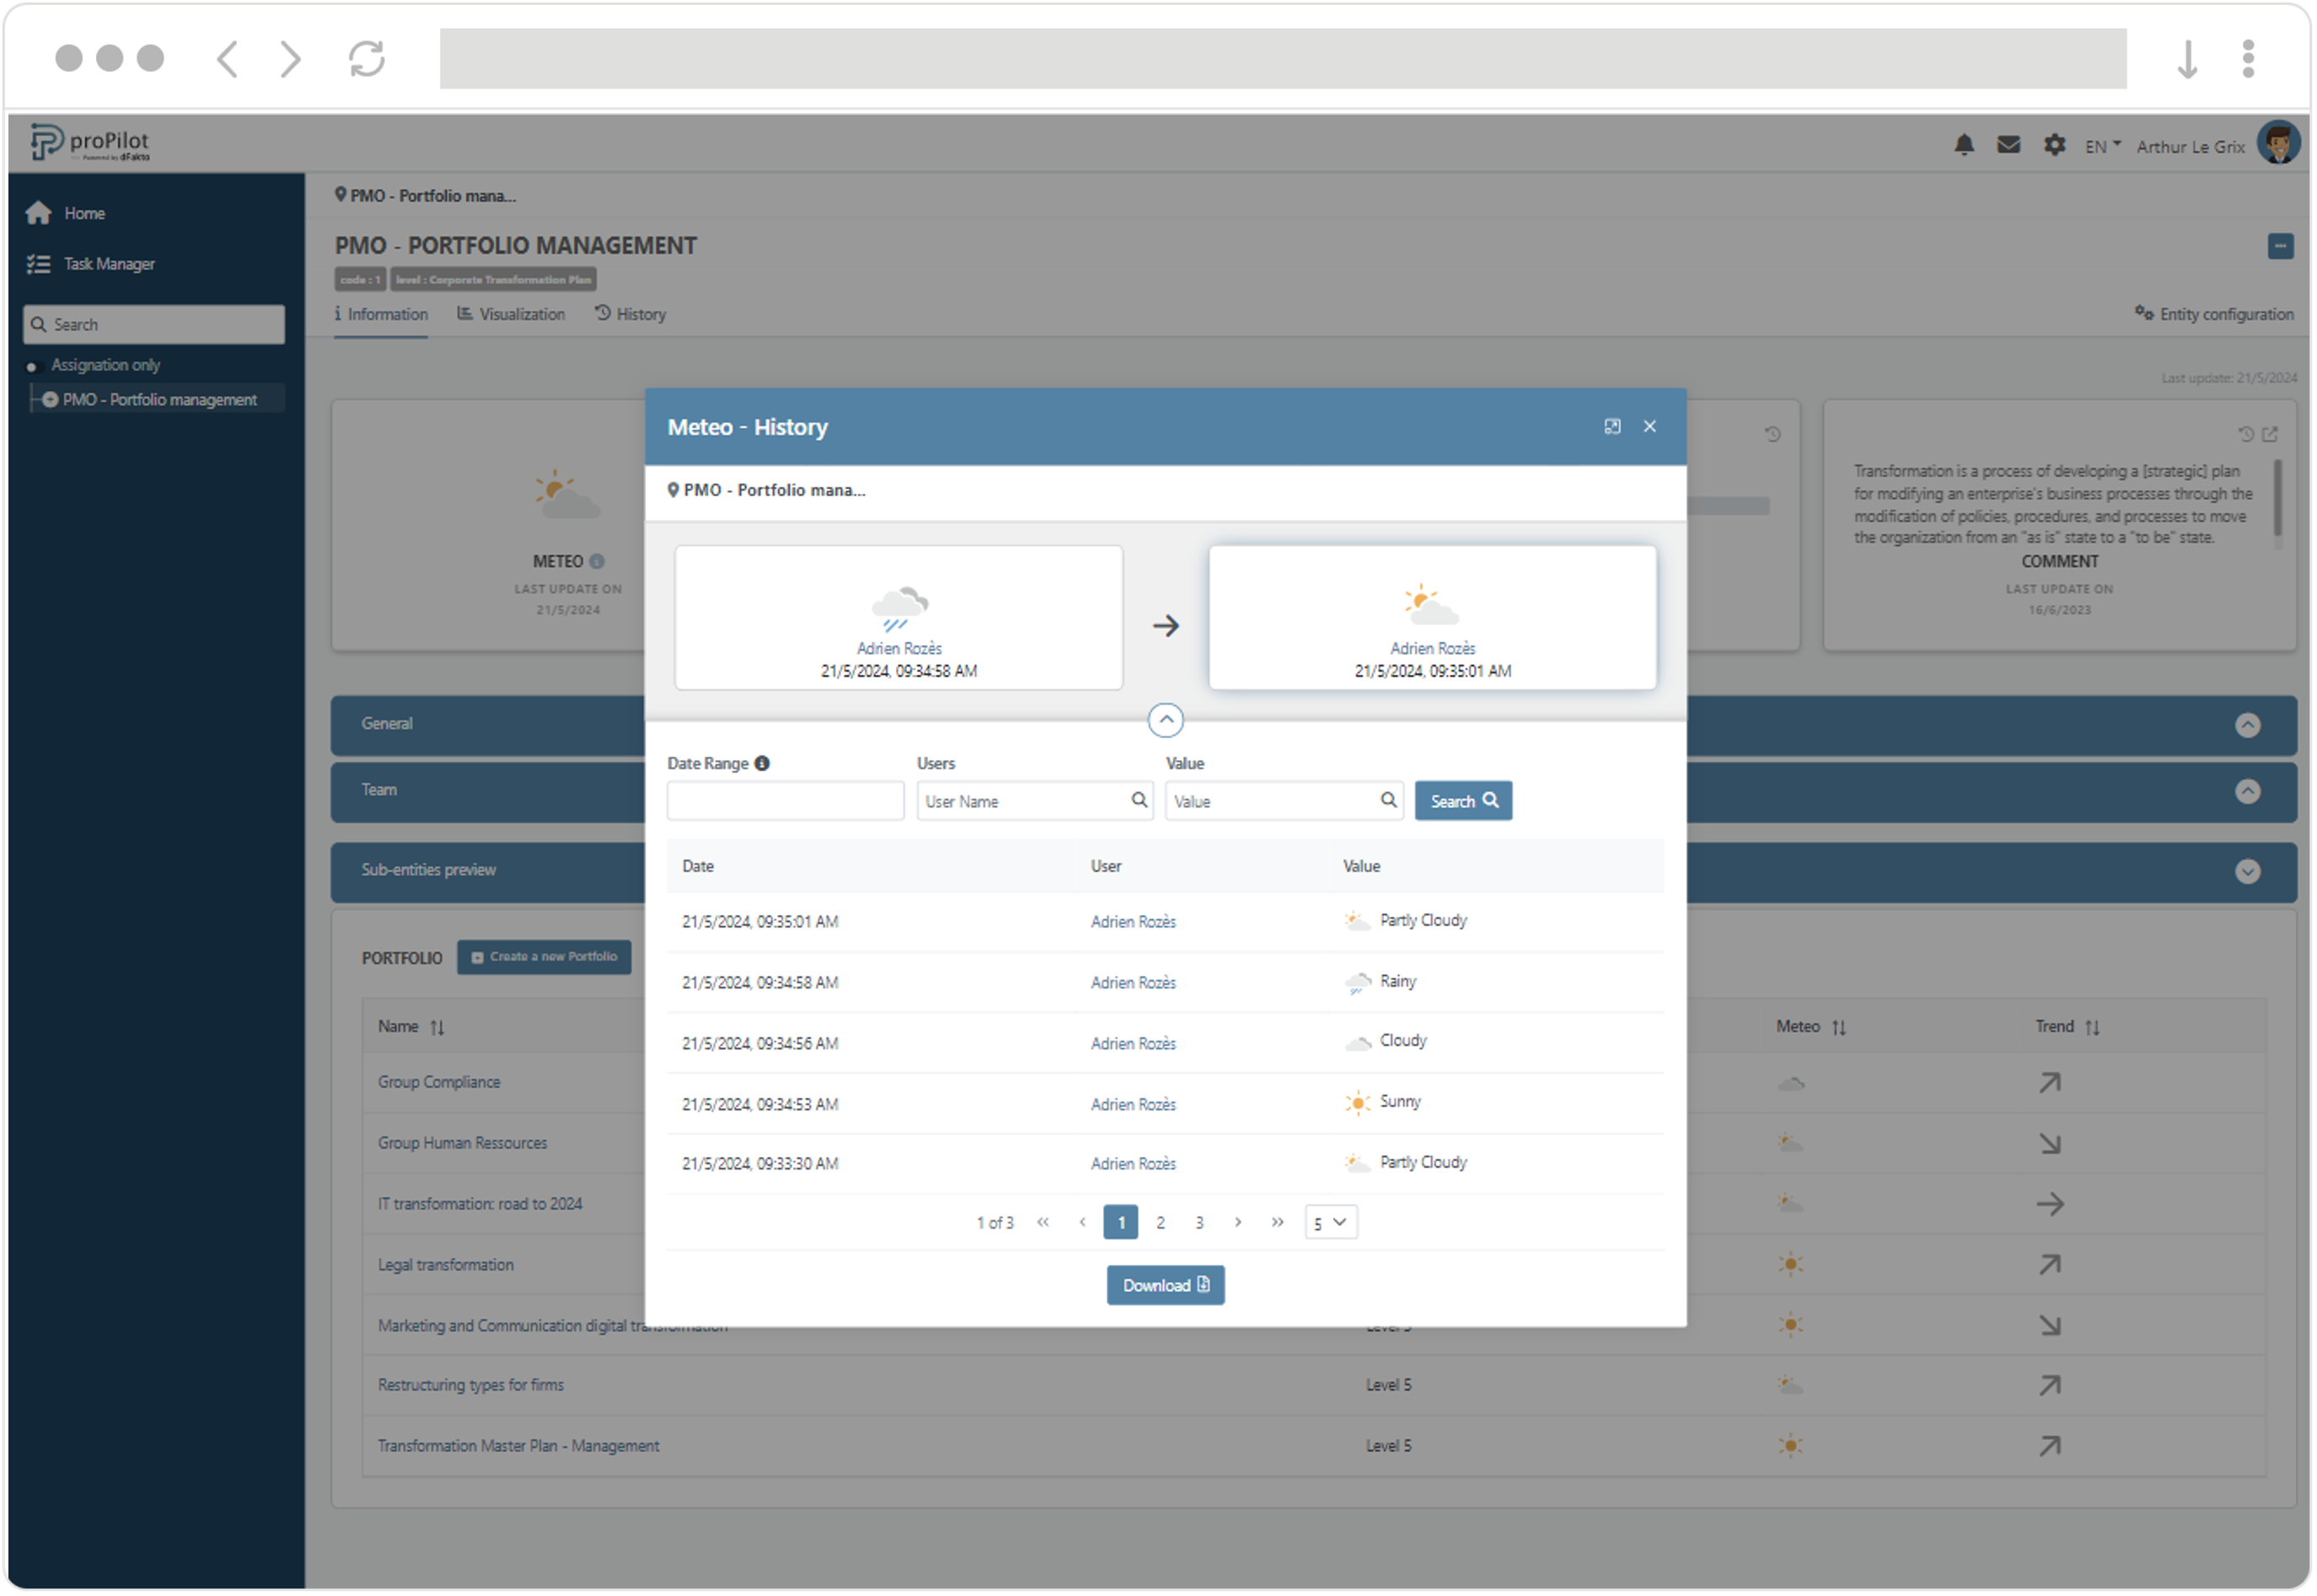
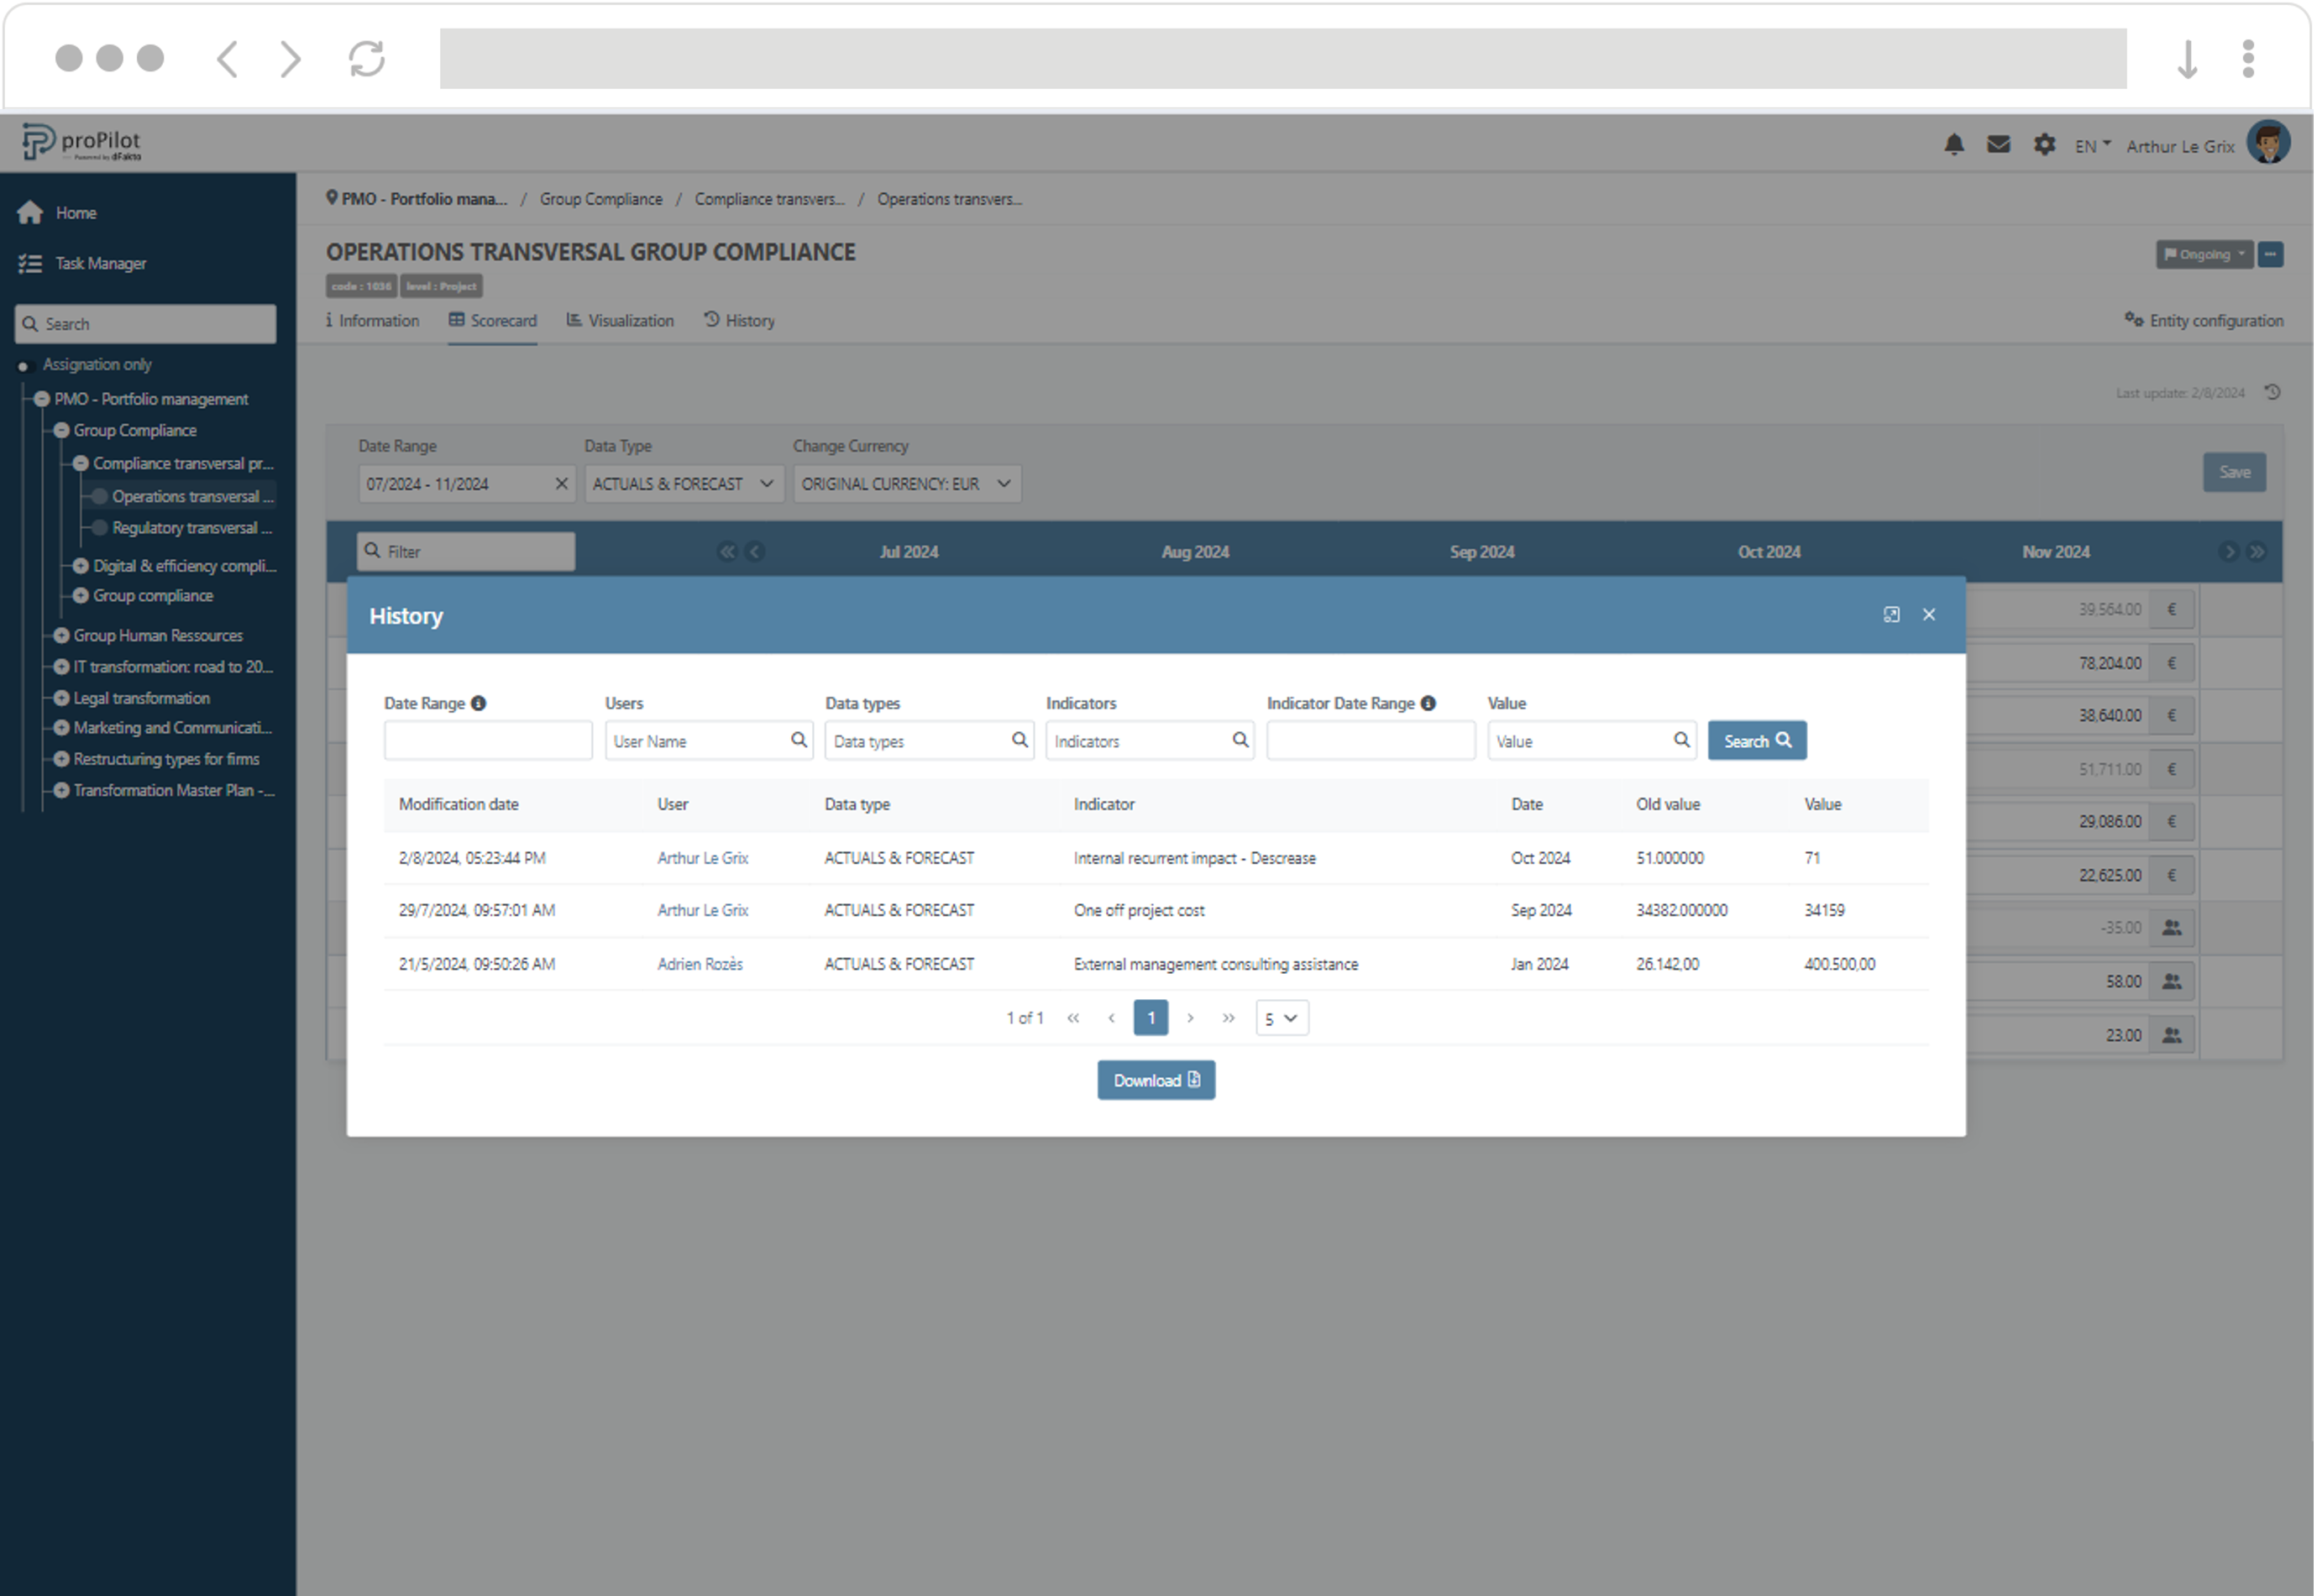
With the new contextual history, you can directly visualize changes to your information and indicators
For each information and for your indicators, you have a dedicated interface where you can view the history of values and the person responsible for the changes.
-
The latest change is visible in tile format, providing a quick overview of the most recent update
-
The history can be easily filtered by date, user, and value. Indicators can be filtered by name and data type (budget, actual, etc.).
-
All data can be exported in a structured and auditable format.
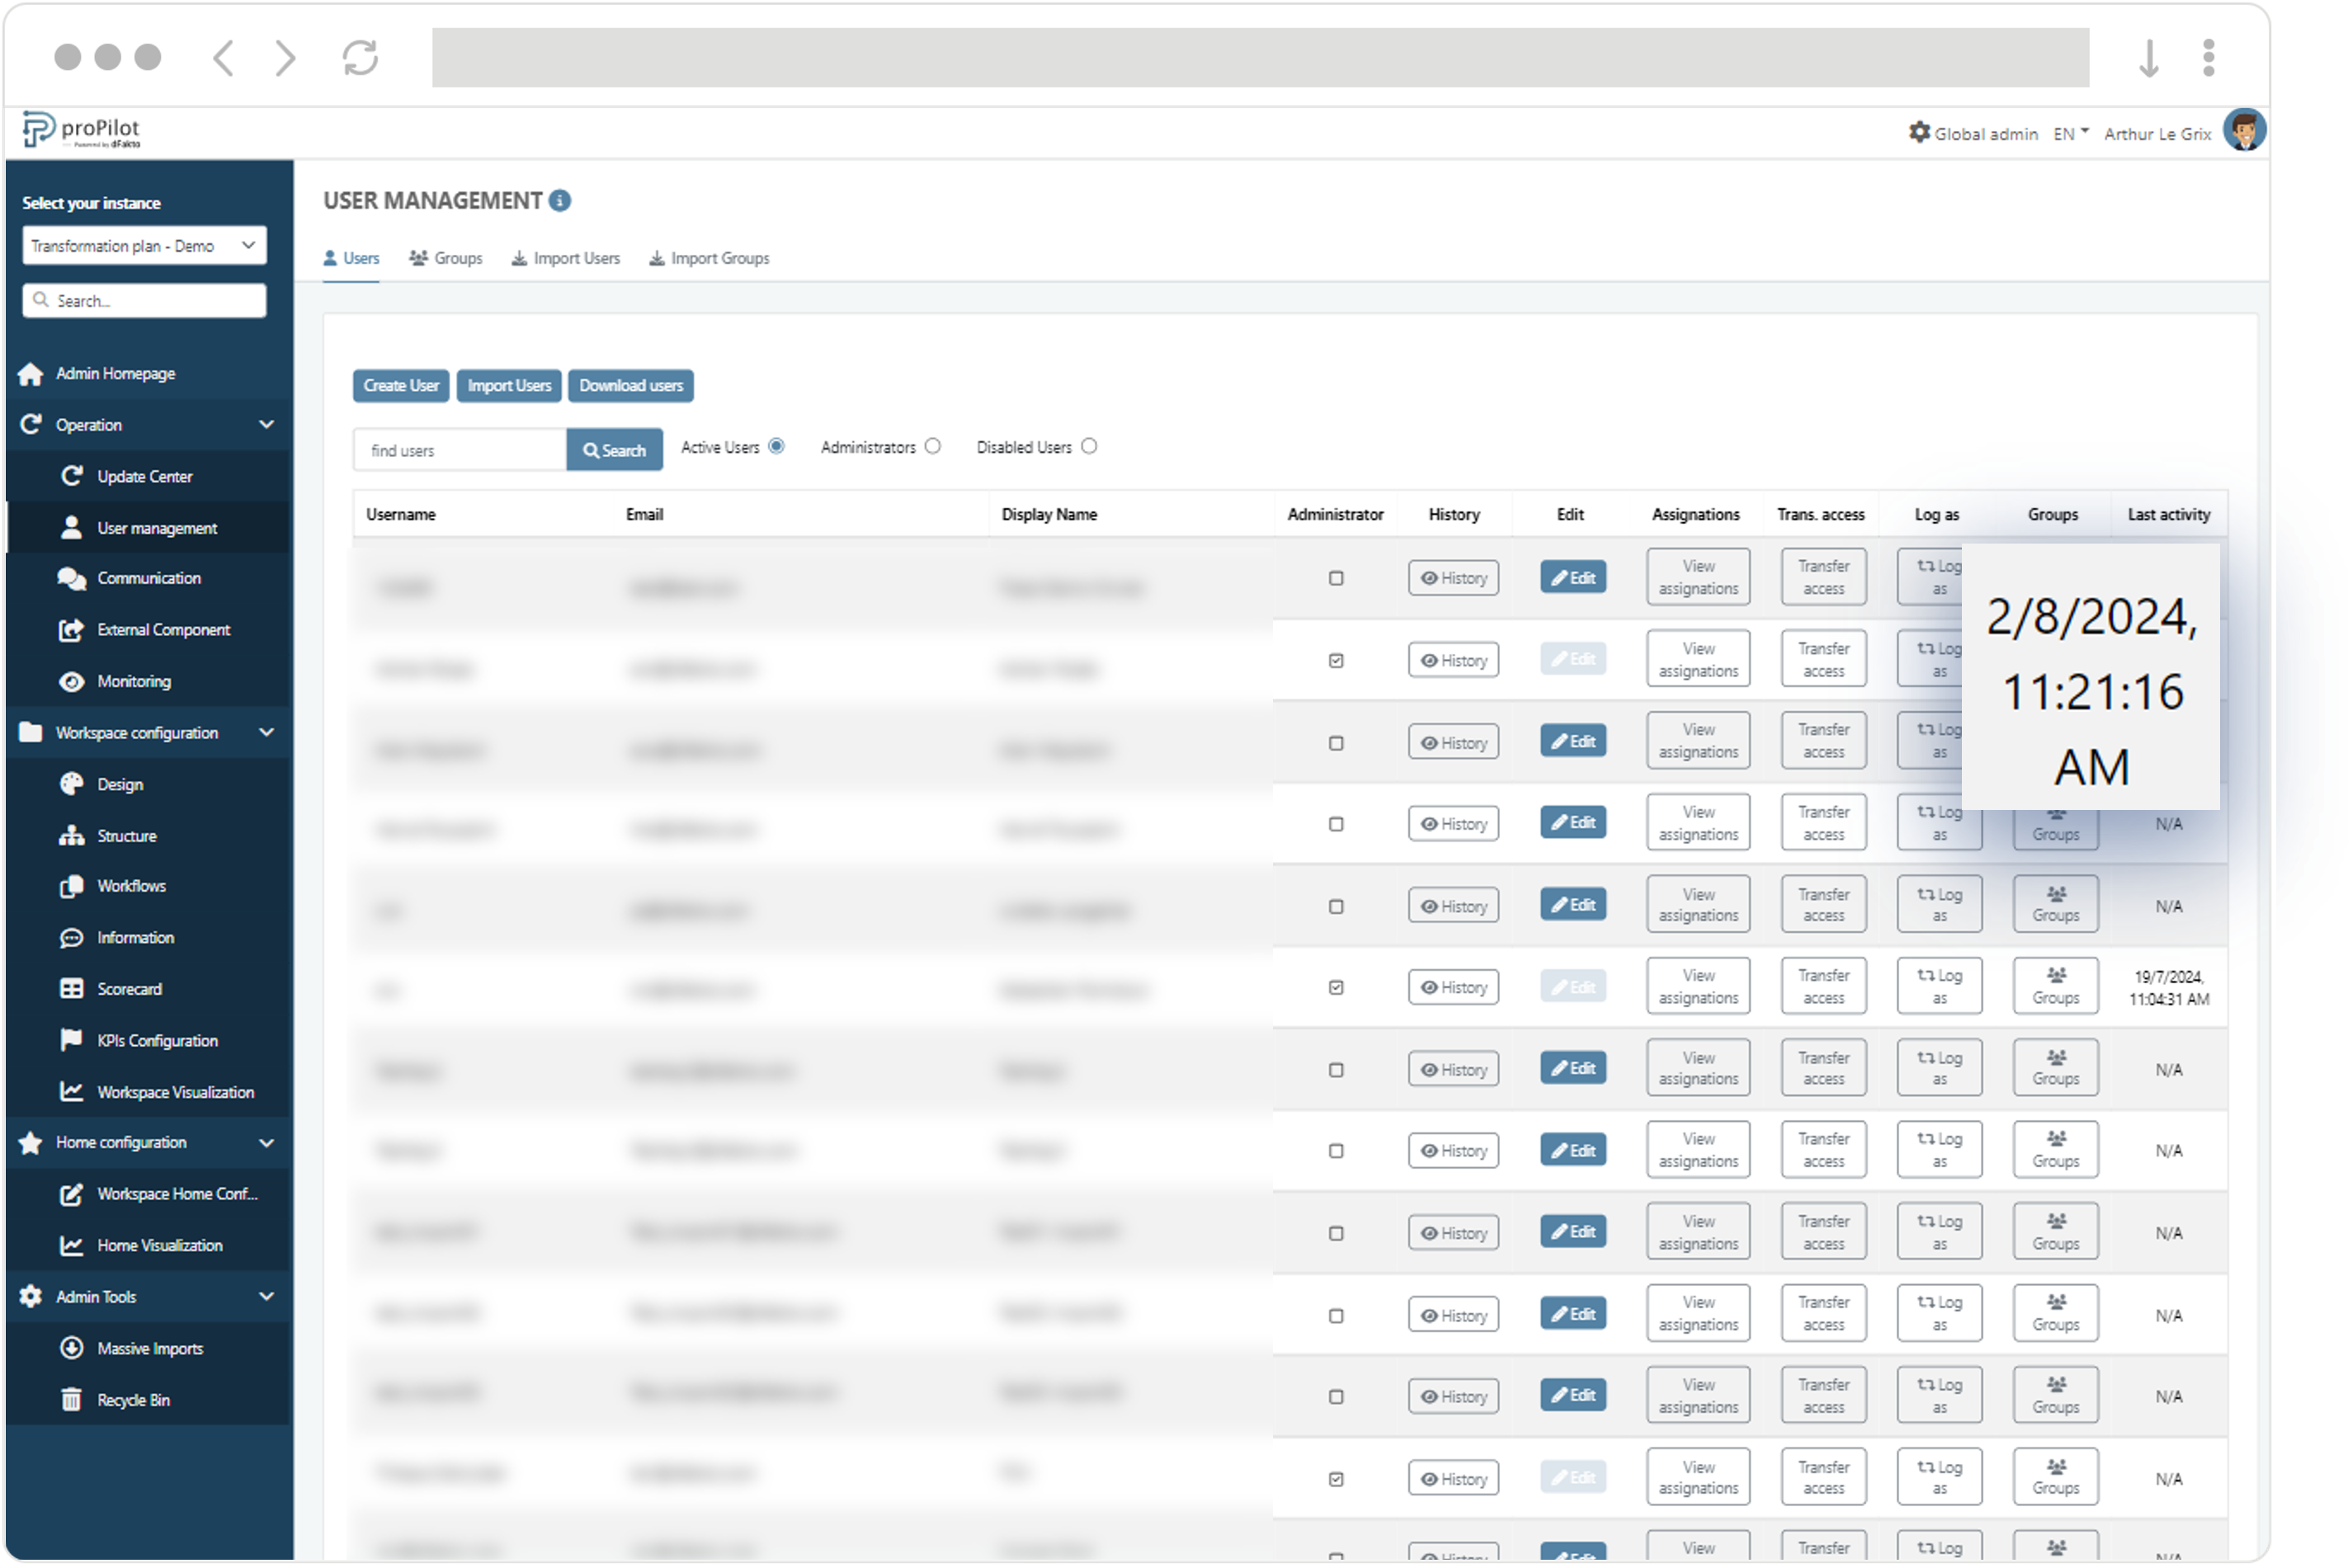
Monitor the activity of your proPilot users and improve access reviews
As a PMO, you can now track the last login date of your proPilot users. You can view the date and time of the last activity of different users in the user panel of the global and local administration.
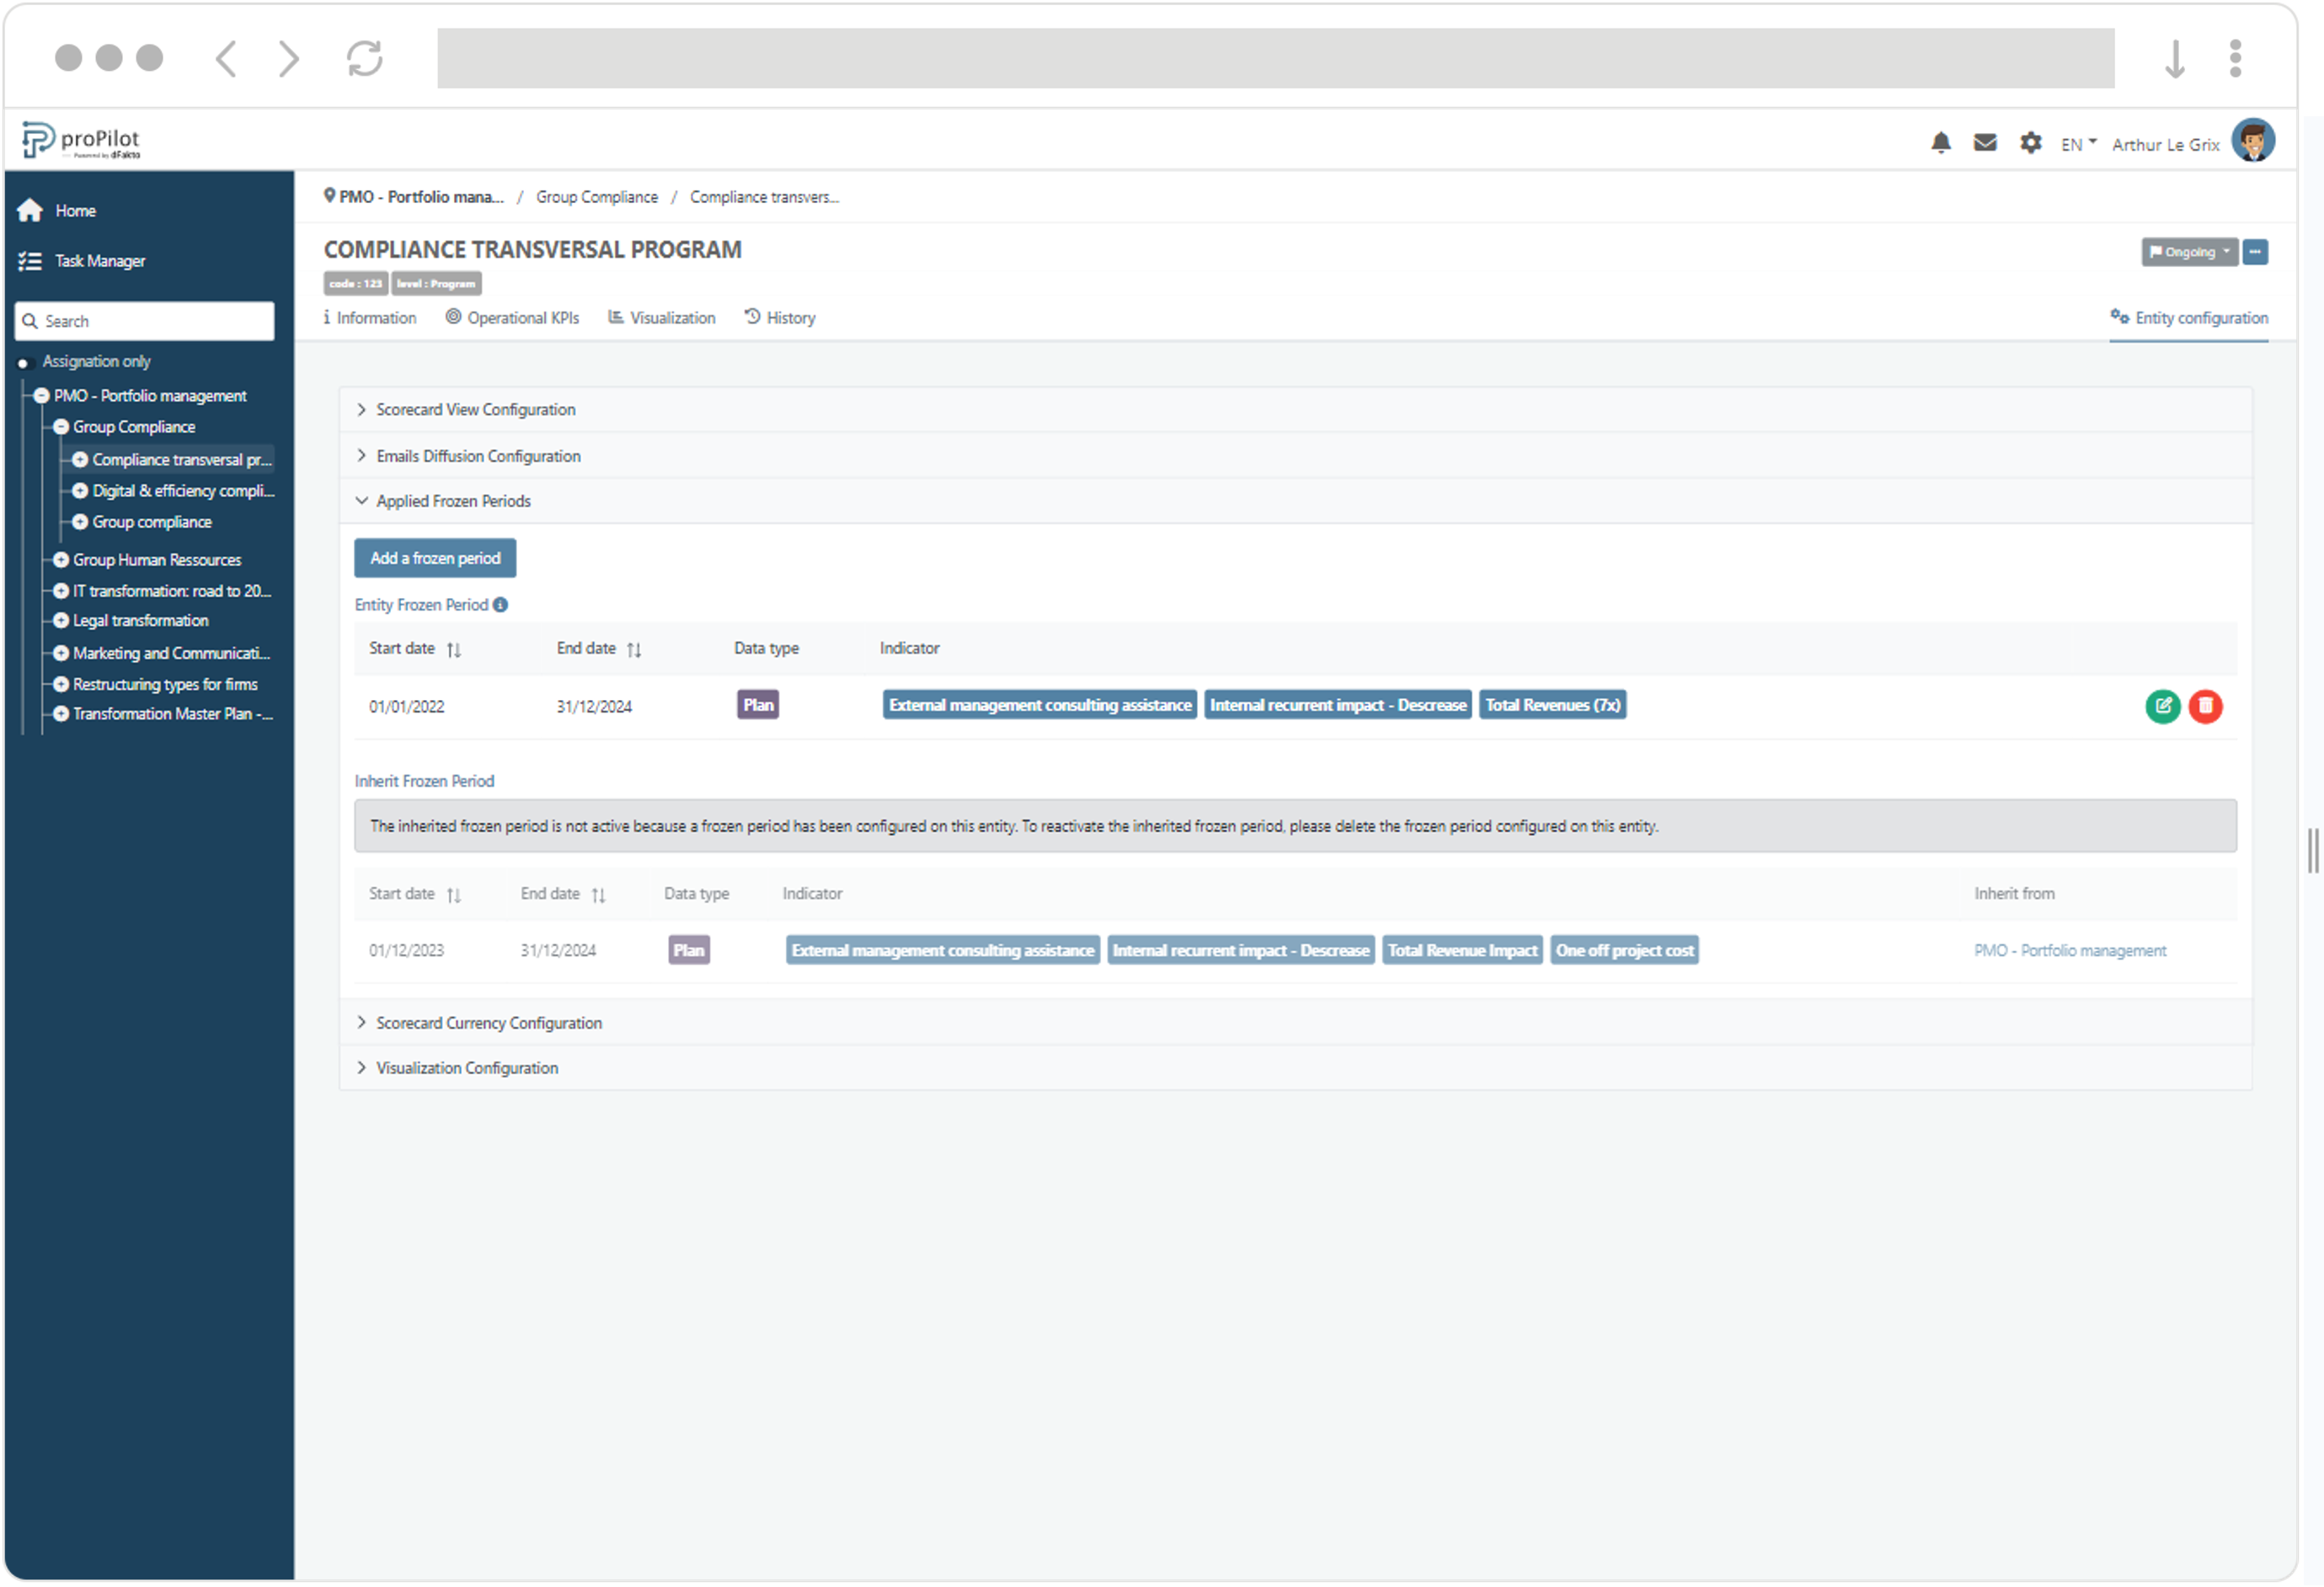
The "frozen periods" have been redesigned for comprehensive control over indicator entry restrictions
-
You can now configure a frozen period for multiple indicators and data types.
-
At each level of the structure, you can see inherited frozen periods and the presence of exception configurations.
-
The appearance and ergonomics of the configuration interface have also been optimized.
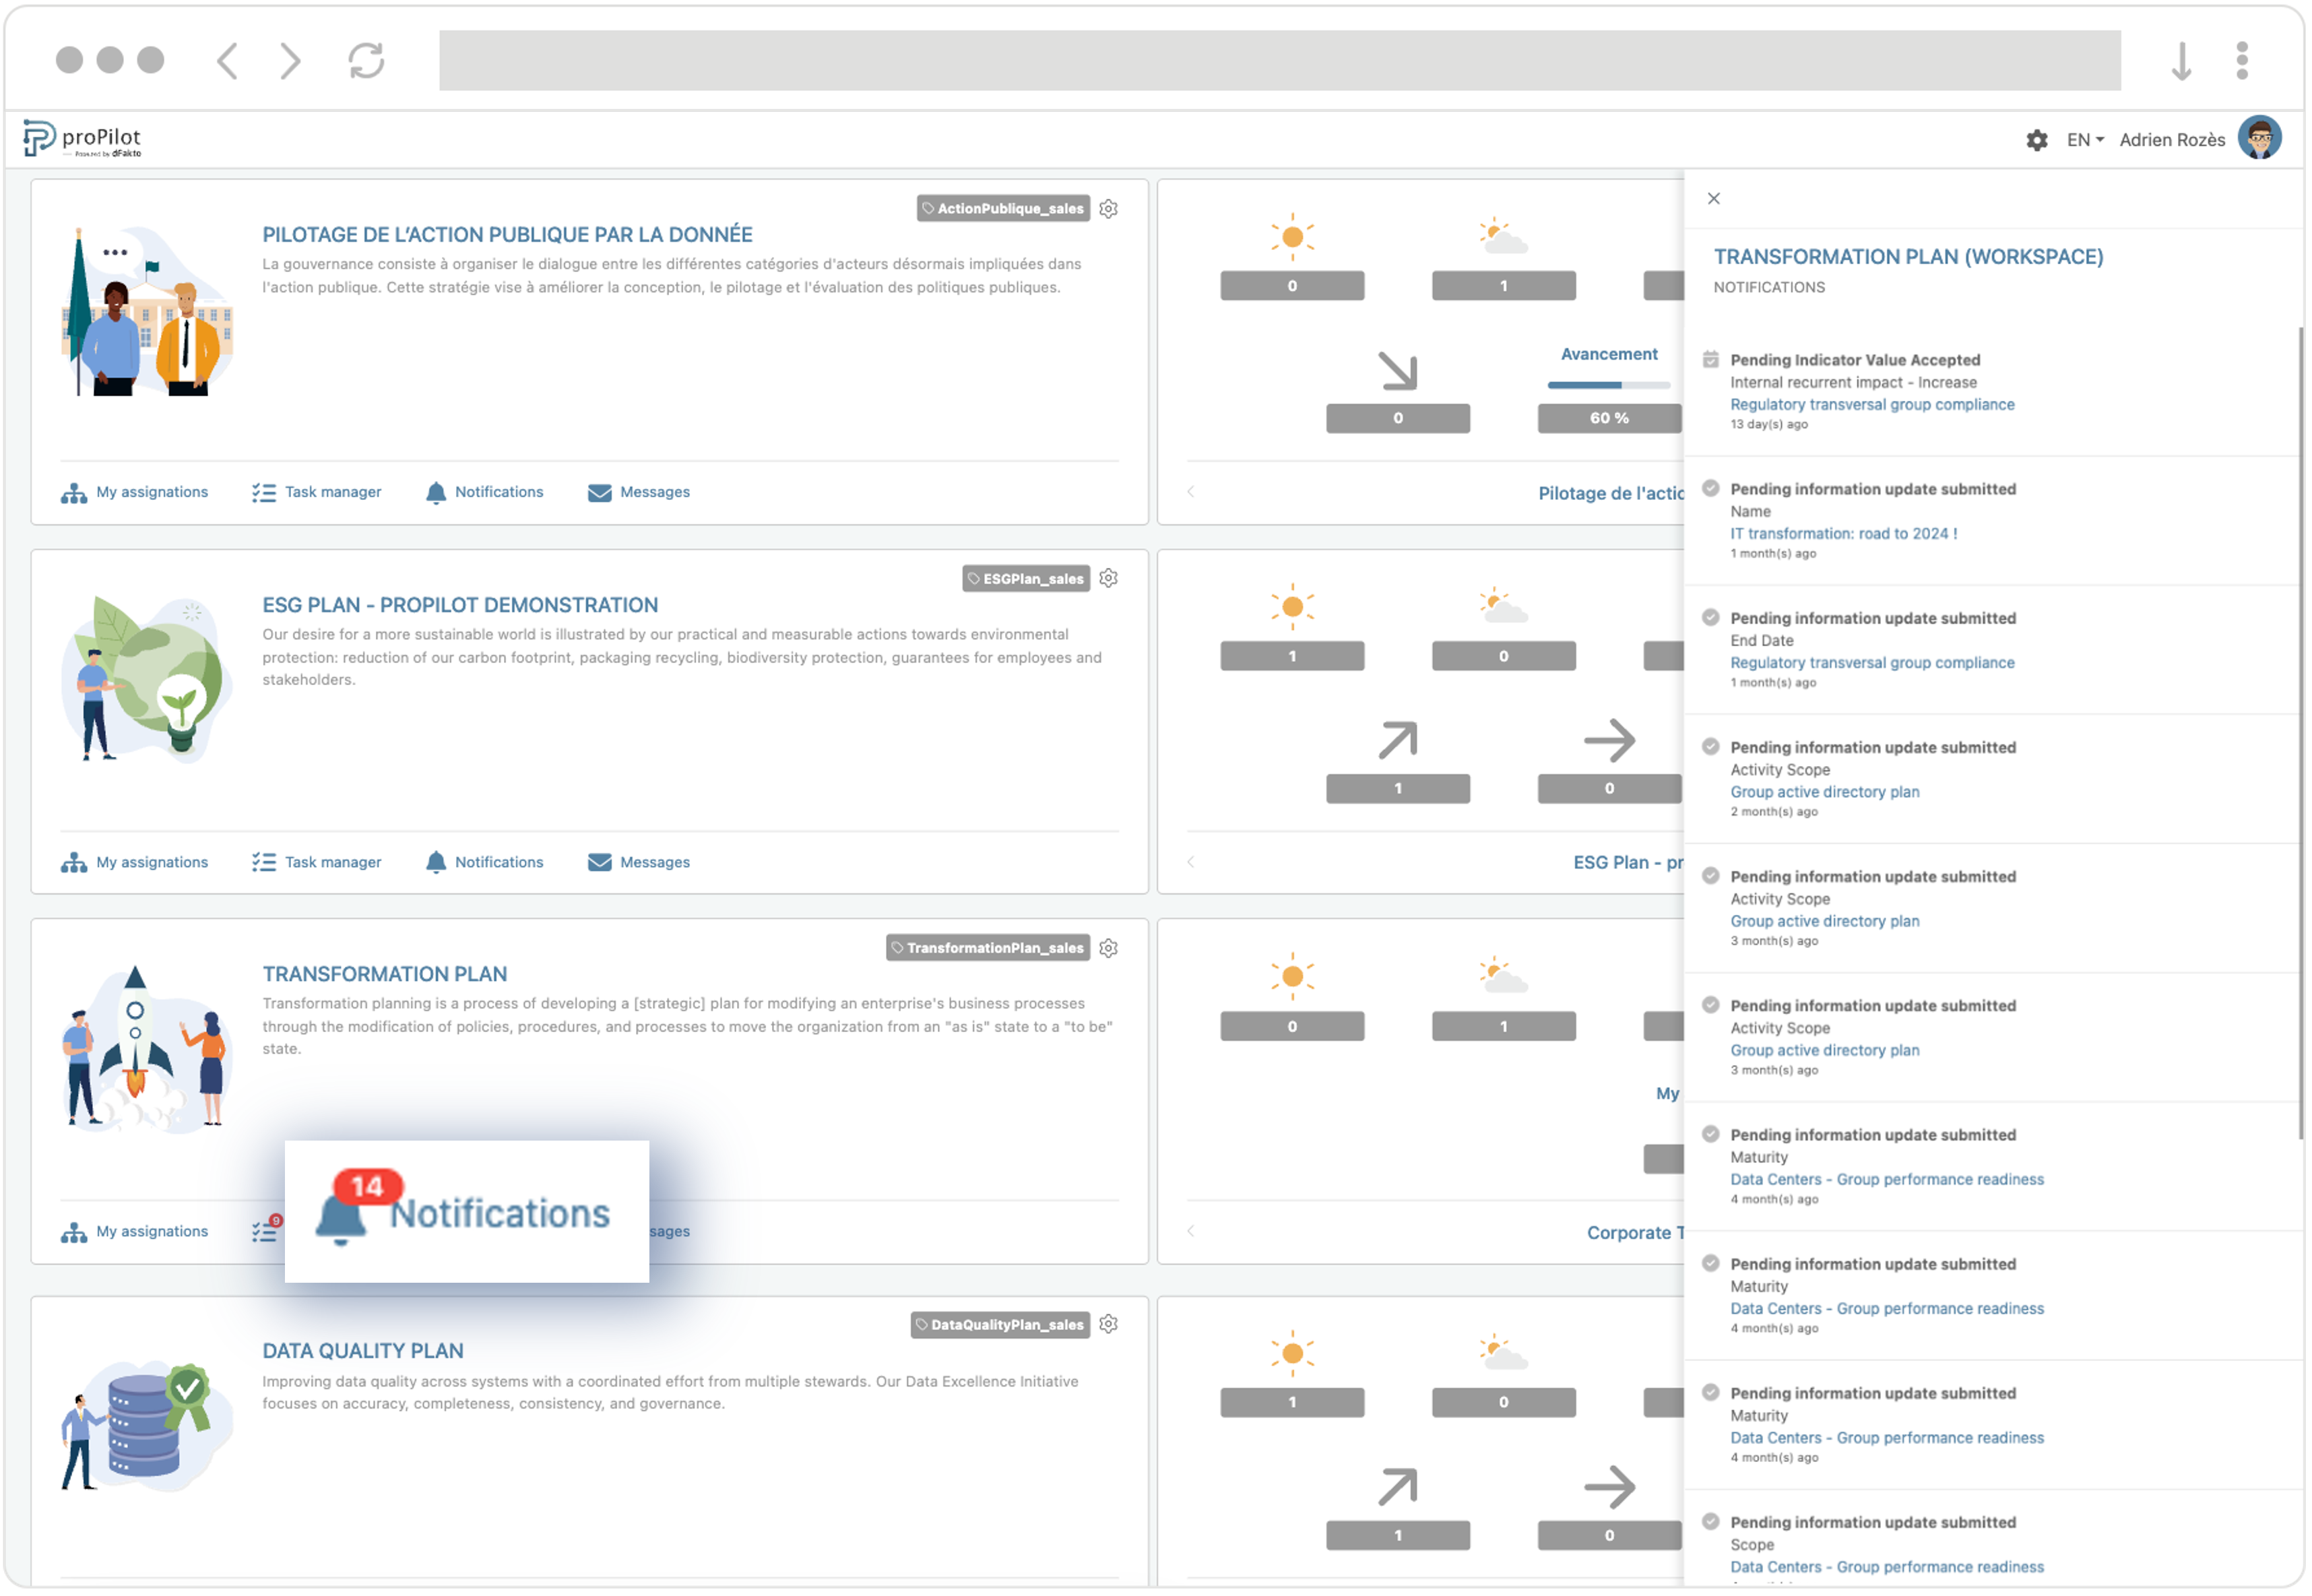
Check your notifications upon login
Notifications are now available right on the homepage for your various workspaces.
Lots of changes… Multiple improvements are made with each version upgrade!
-
The workflows for creating and moving entities for users have been improved.
-
The transition of lifecycle statuses has been enhanced.
-
Interdependencies on the display of selected dates for the indicators table have been removed.
-
The "Comparison Tool" visualization now better handles the display of cumulated values for auto-calculated indicators.
-
The clarity of filter descriptions for graph-type visualizations has been improved.
-
The search function for entity information on the homepage is more efficient.
-
The display of notifications by workspace scope has been improved.
-
The display of tasks and users in the task manager has been revised.
-
Translations have been enhanced in the workspace and administration interface.
-
In local administration, the display of users by status is more intuitive.
-
The management of "favorite" administration modules has been improved.
-
The consistency of change histories in the administration has been reinforced.
-
The adaptation of the application to device sizes, especially tablets and smartphones, has been optimized.