Introduction
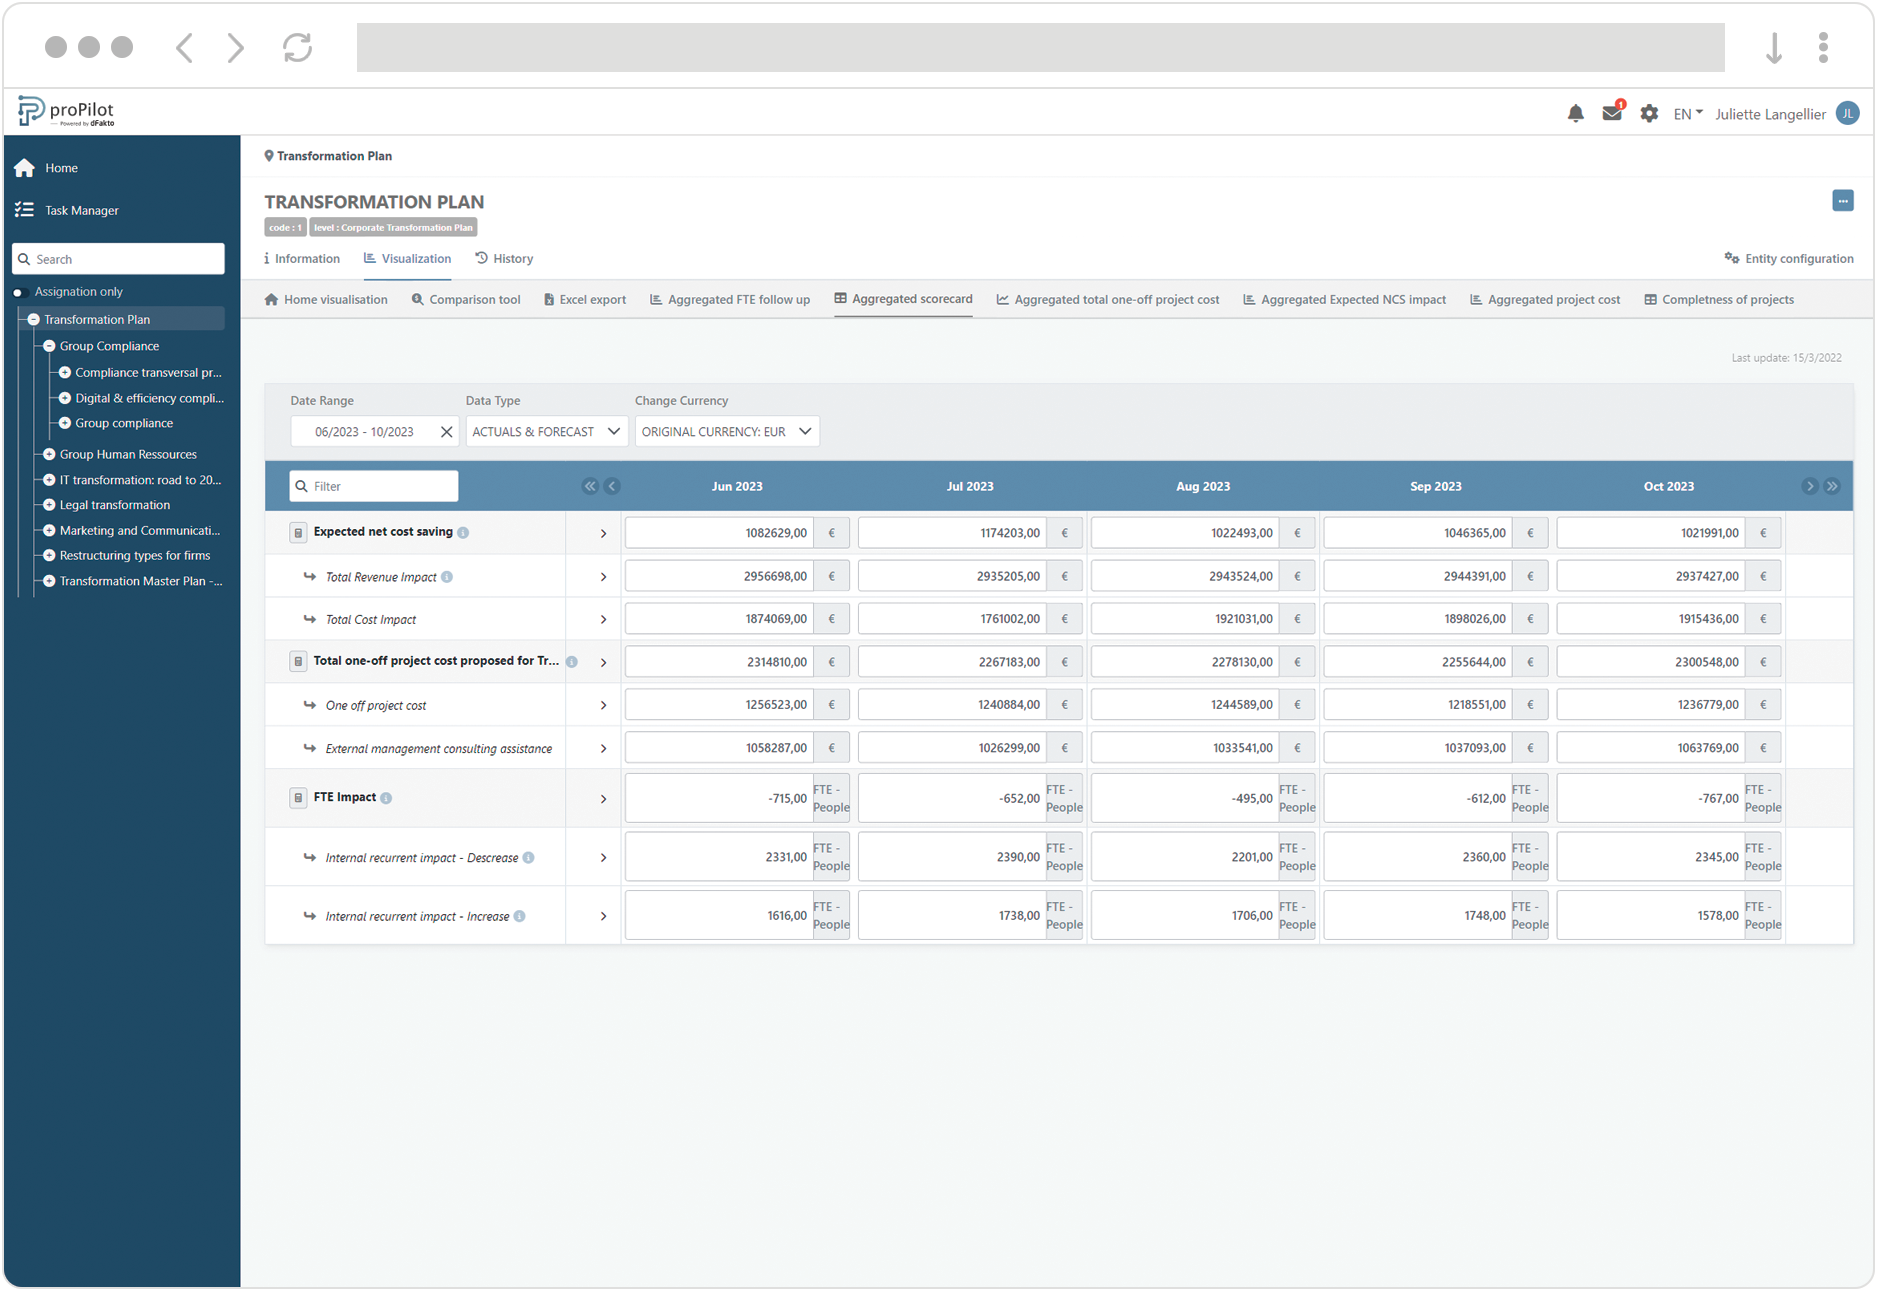
This module allows you to display an aggregated scorecard of all the indicators that have been checked as "aggregated". This module will then display the sum of the values entered in the scorecards of the entities of strictly lower level(s).
Think smart : we recommend to collect all calculations terms when collecting non-aggregable values (such as percentages and means) to be able to consolidate those indicators in the aggregated scorecard.
Create an aggregated scorecard visualization
-
This module allows you to display an aggregated scorecard of all the indicators that have been checked as "aggregated". This module will then display the sum of the values entered in the scorecards of the entities of strictly lower level(s).
-
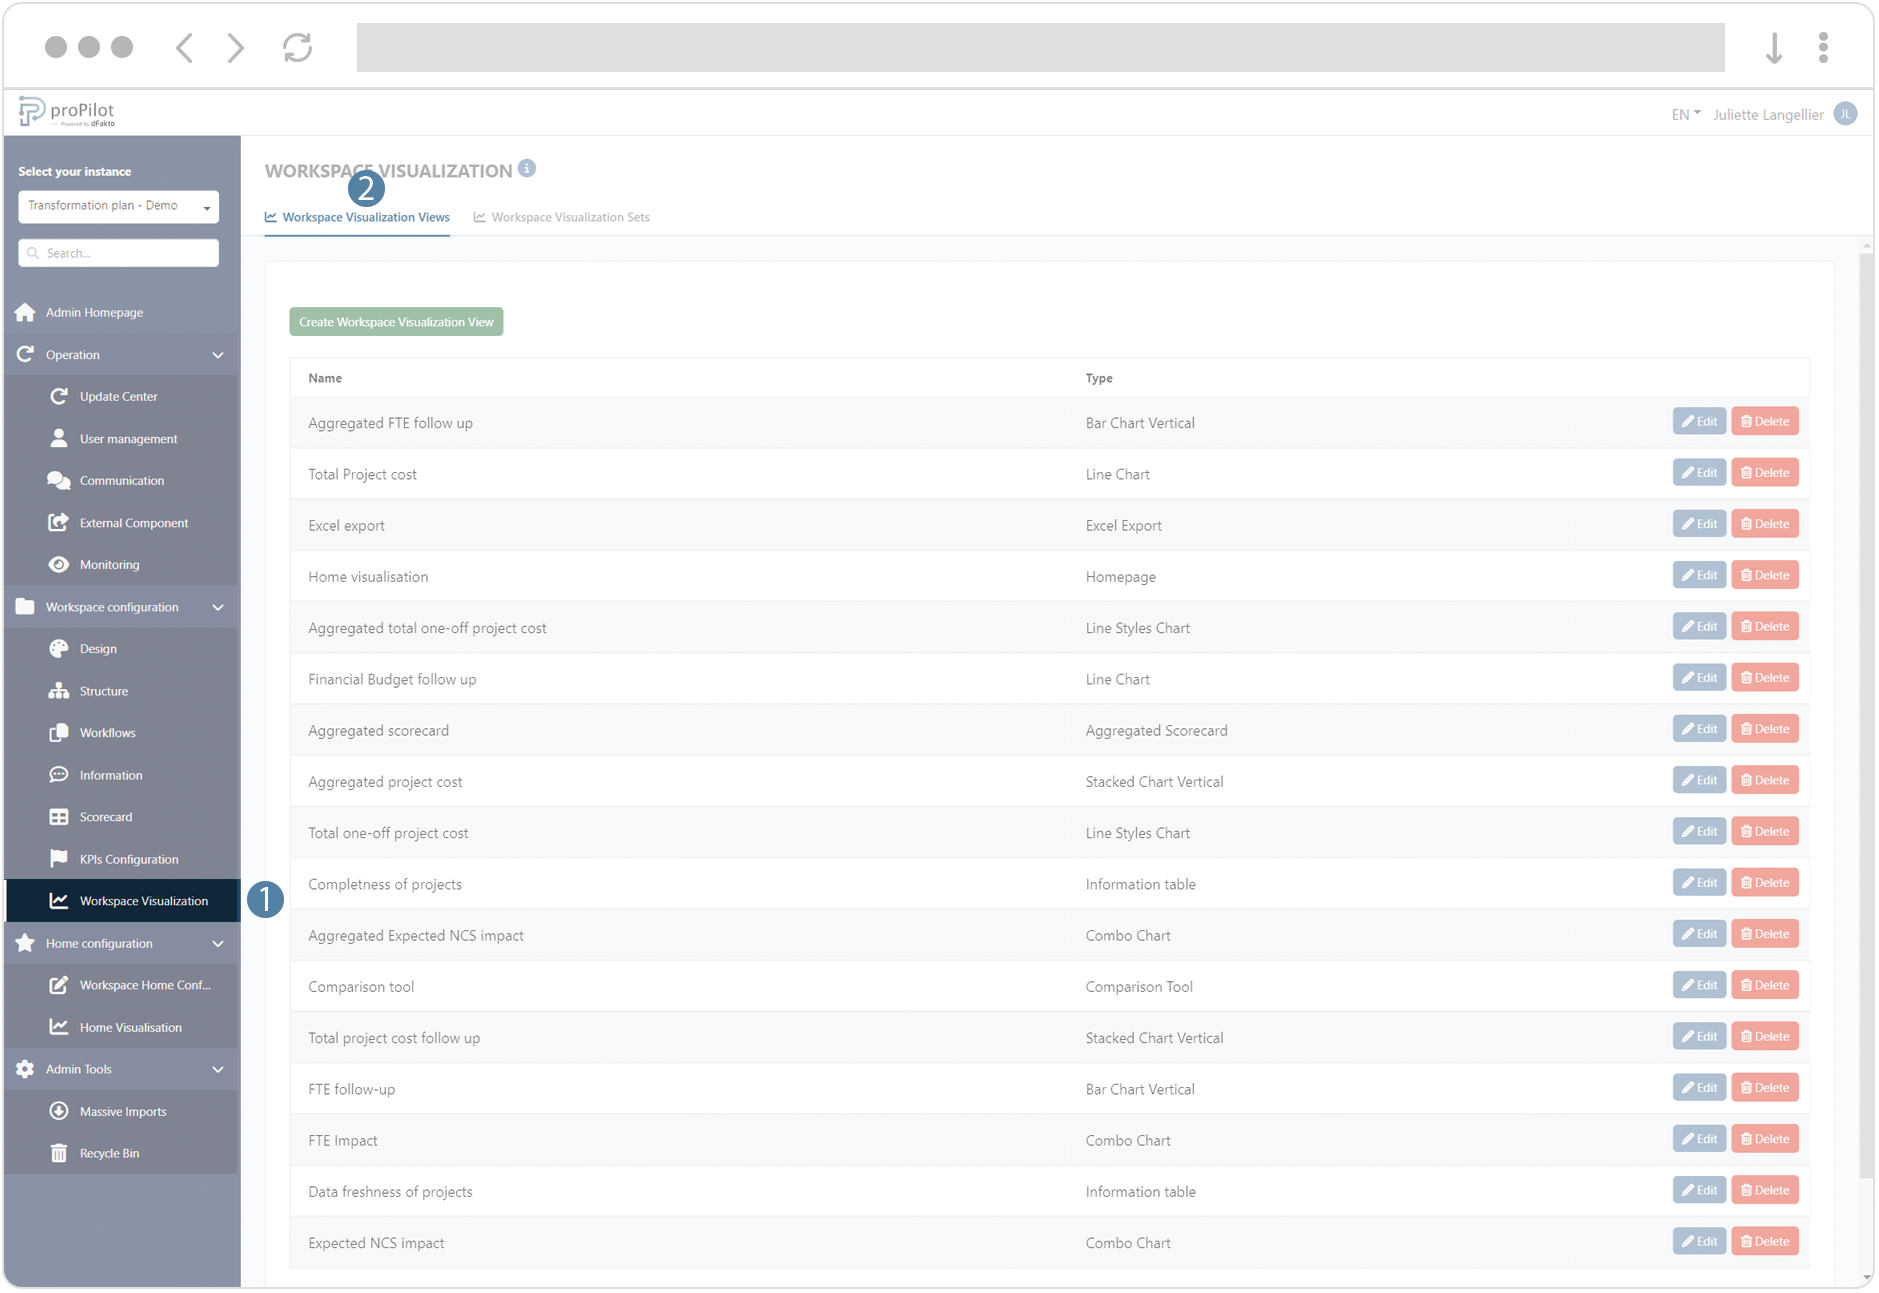
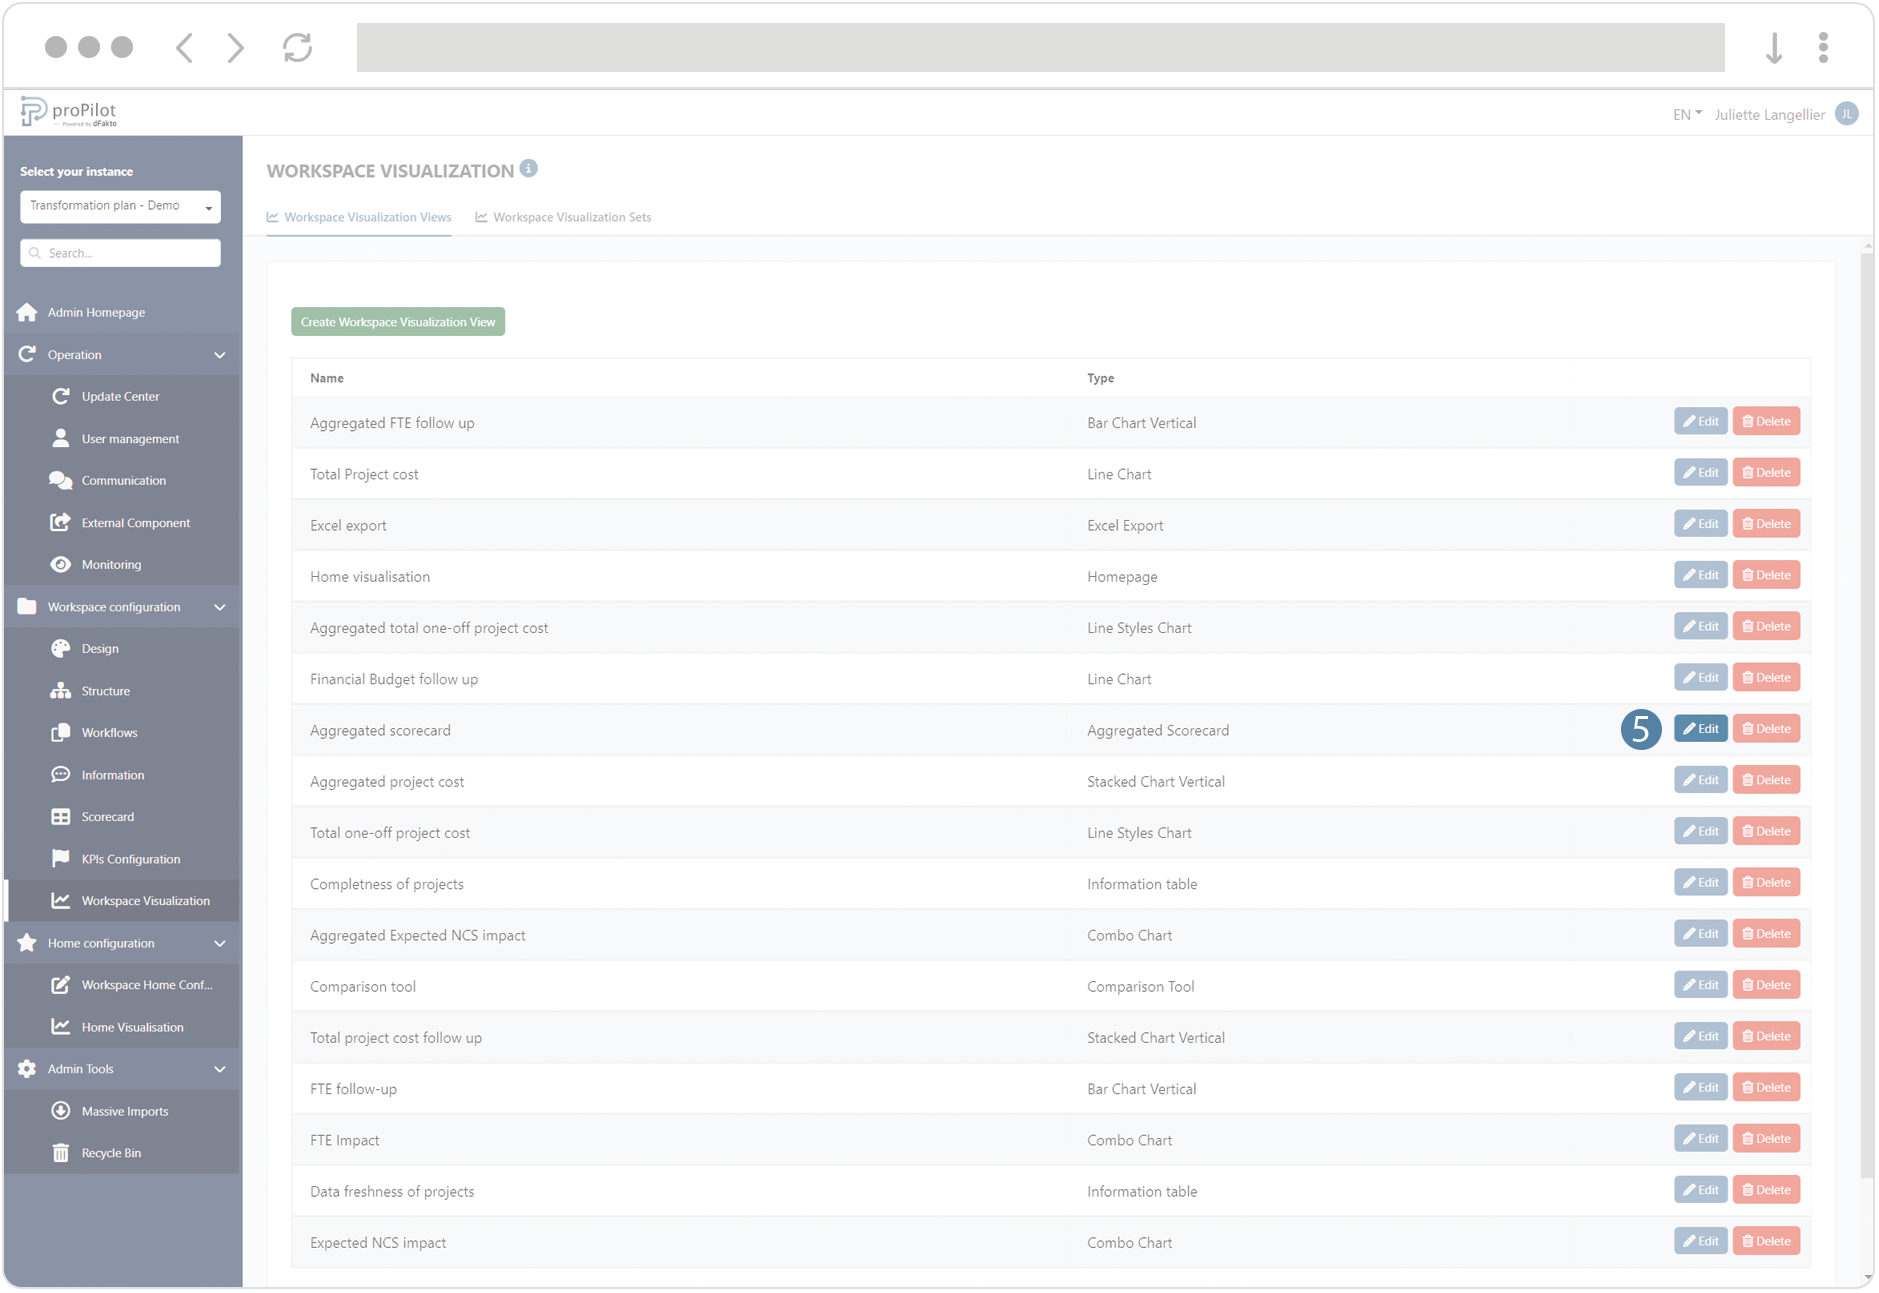
Then click on the "workspace visualization views" tab..
-
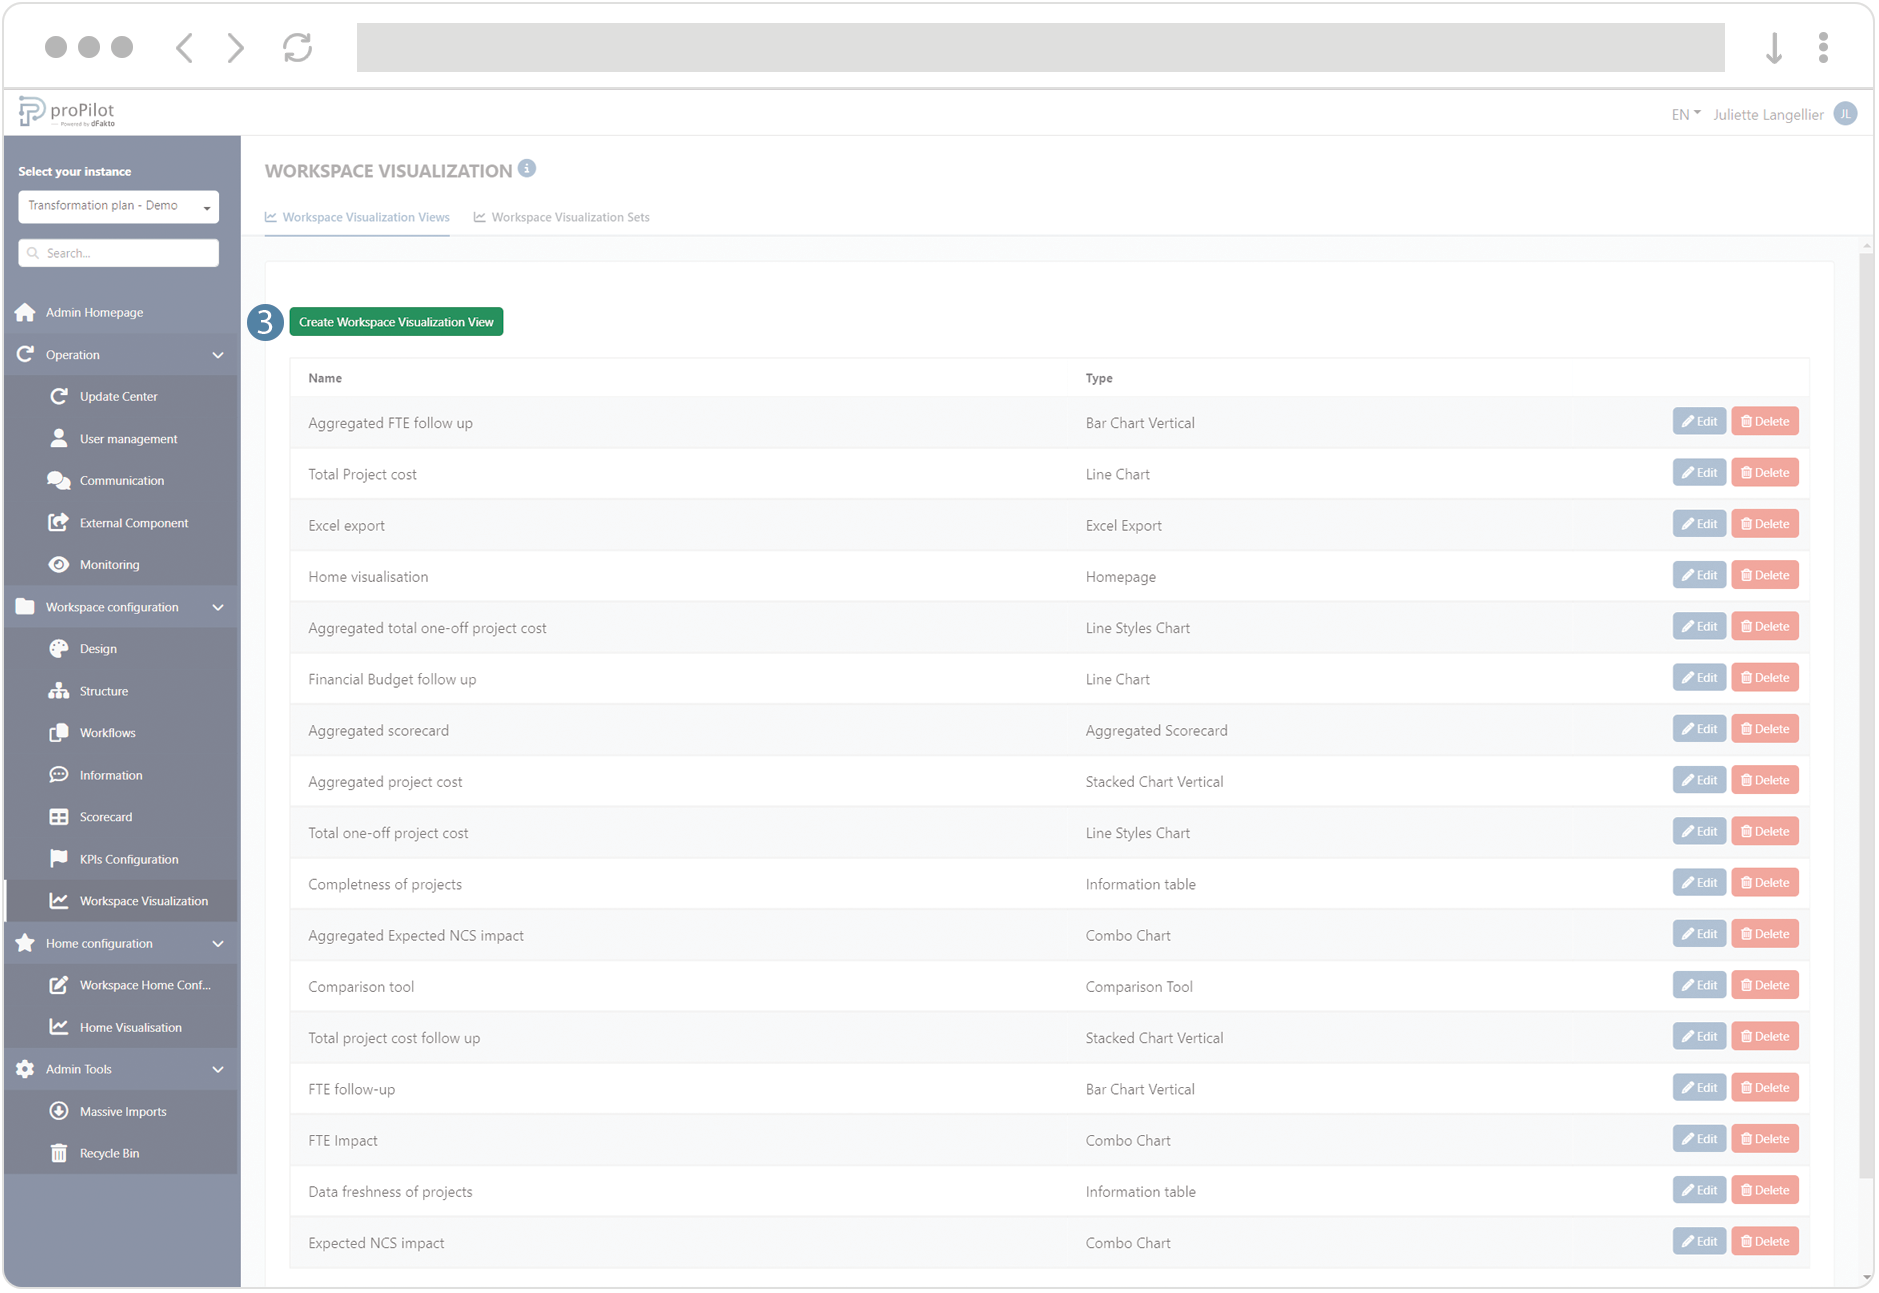
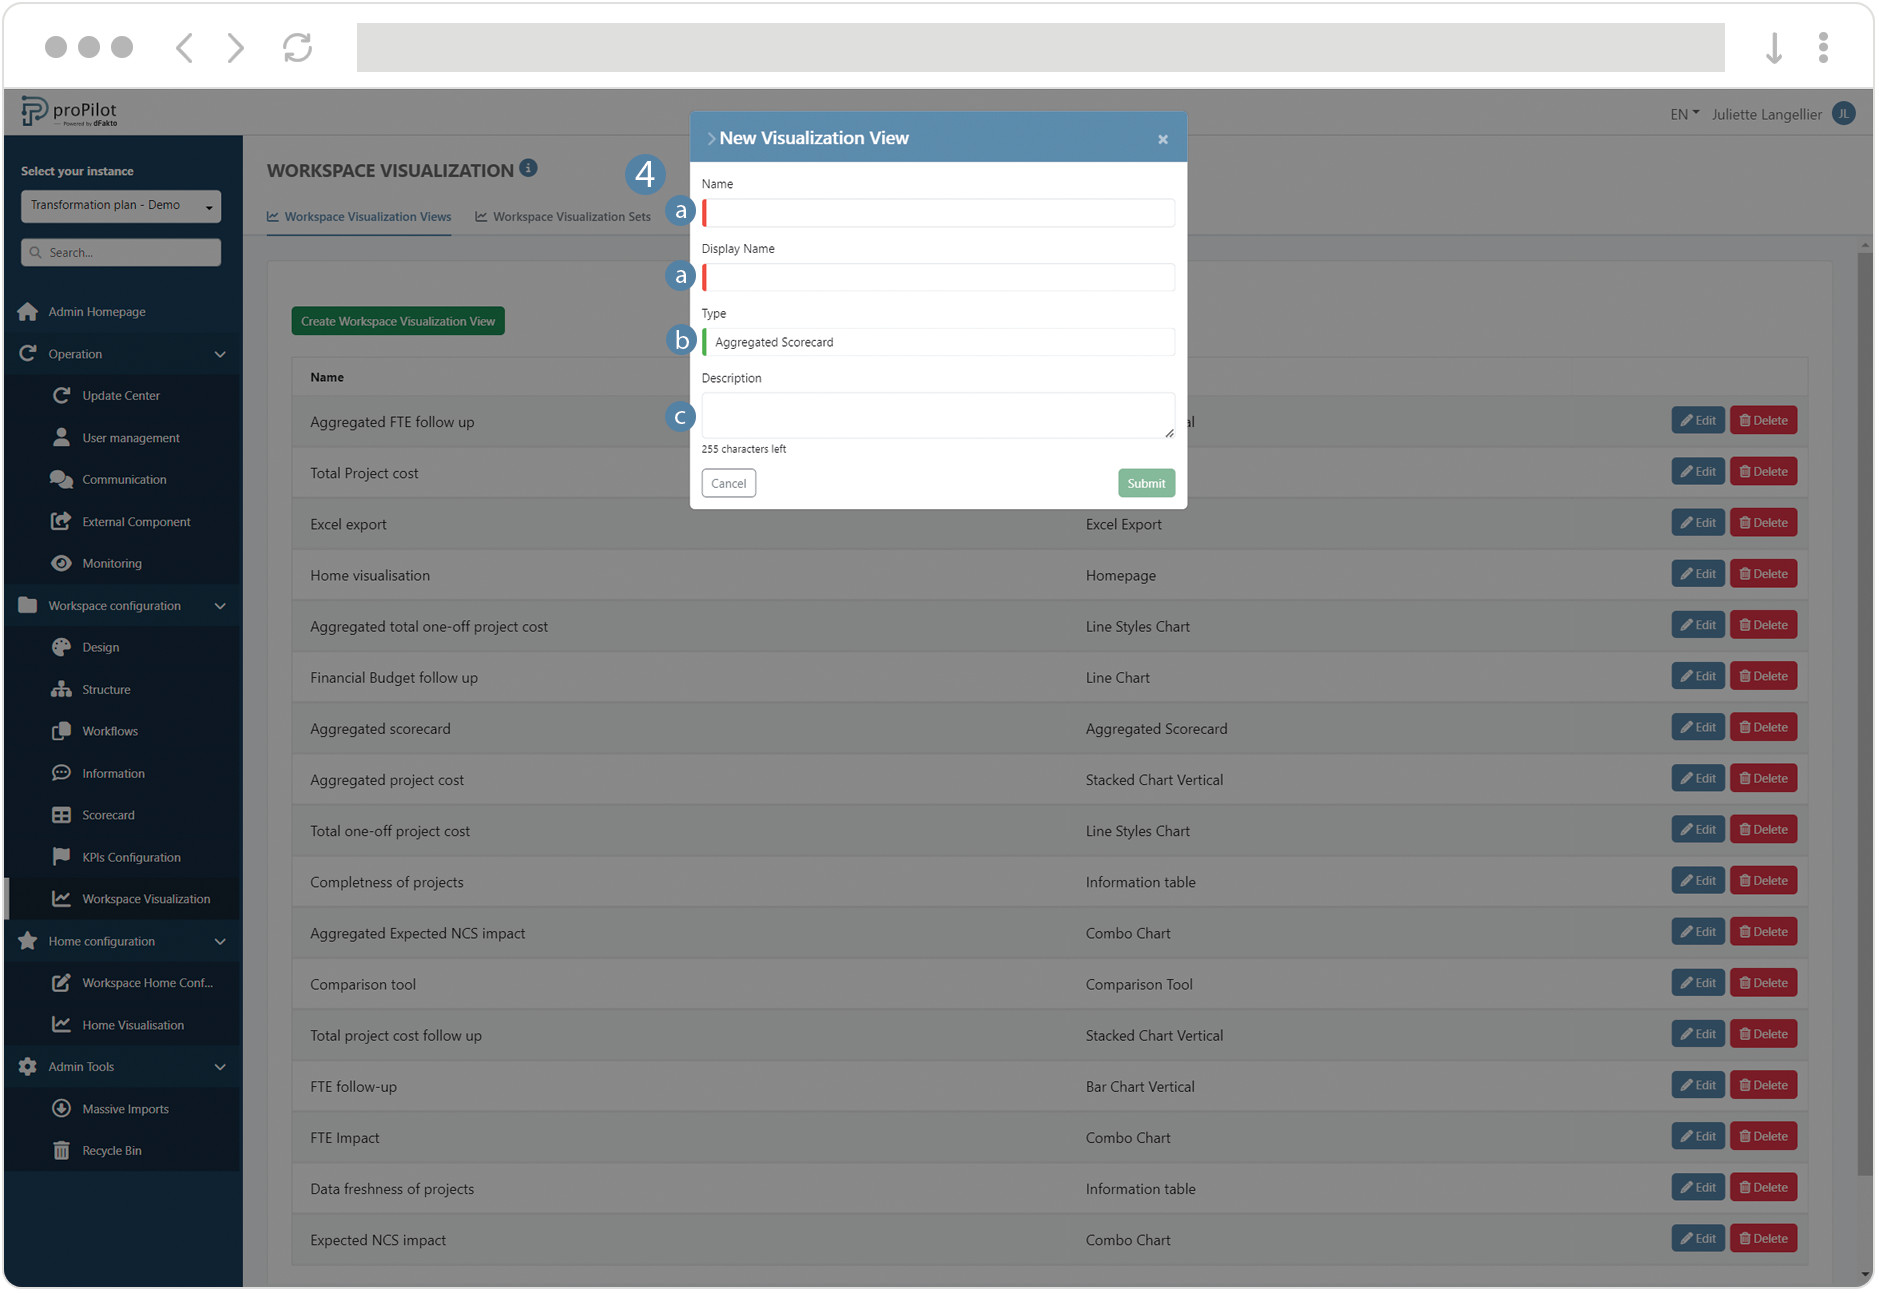
Click on the "create workspace visualization view" button. A pop-up window will open.
-
Fill in the following fields:
-
(technical) name and display name
-
Choose the visualization type "AggregatedScorecard"
-
Add a description if necessary
-
-
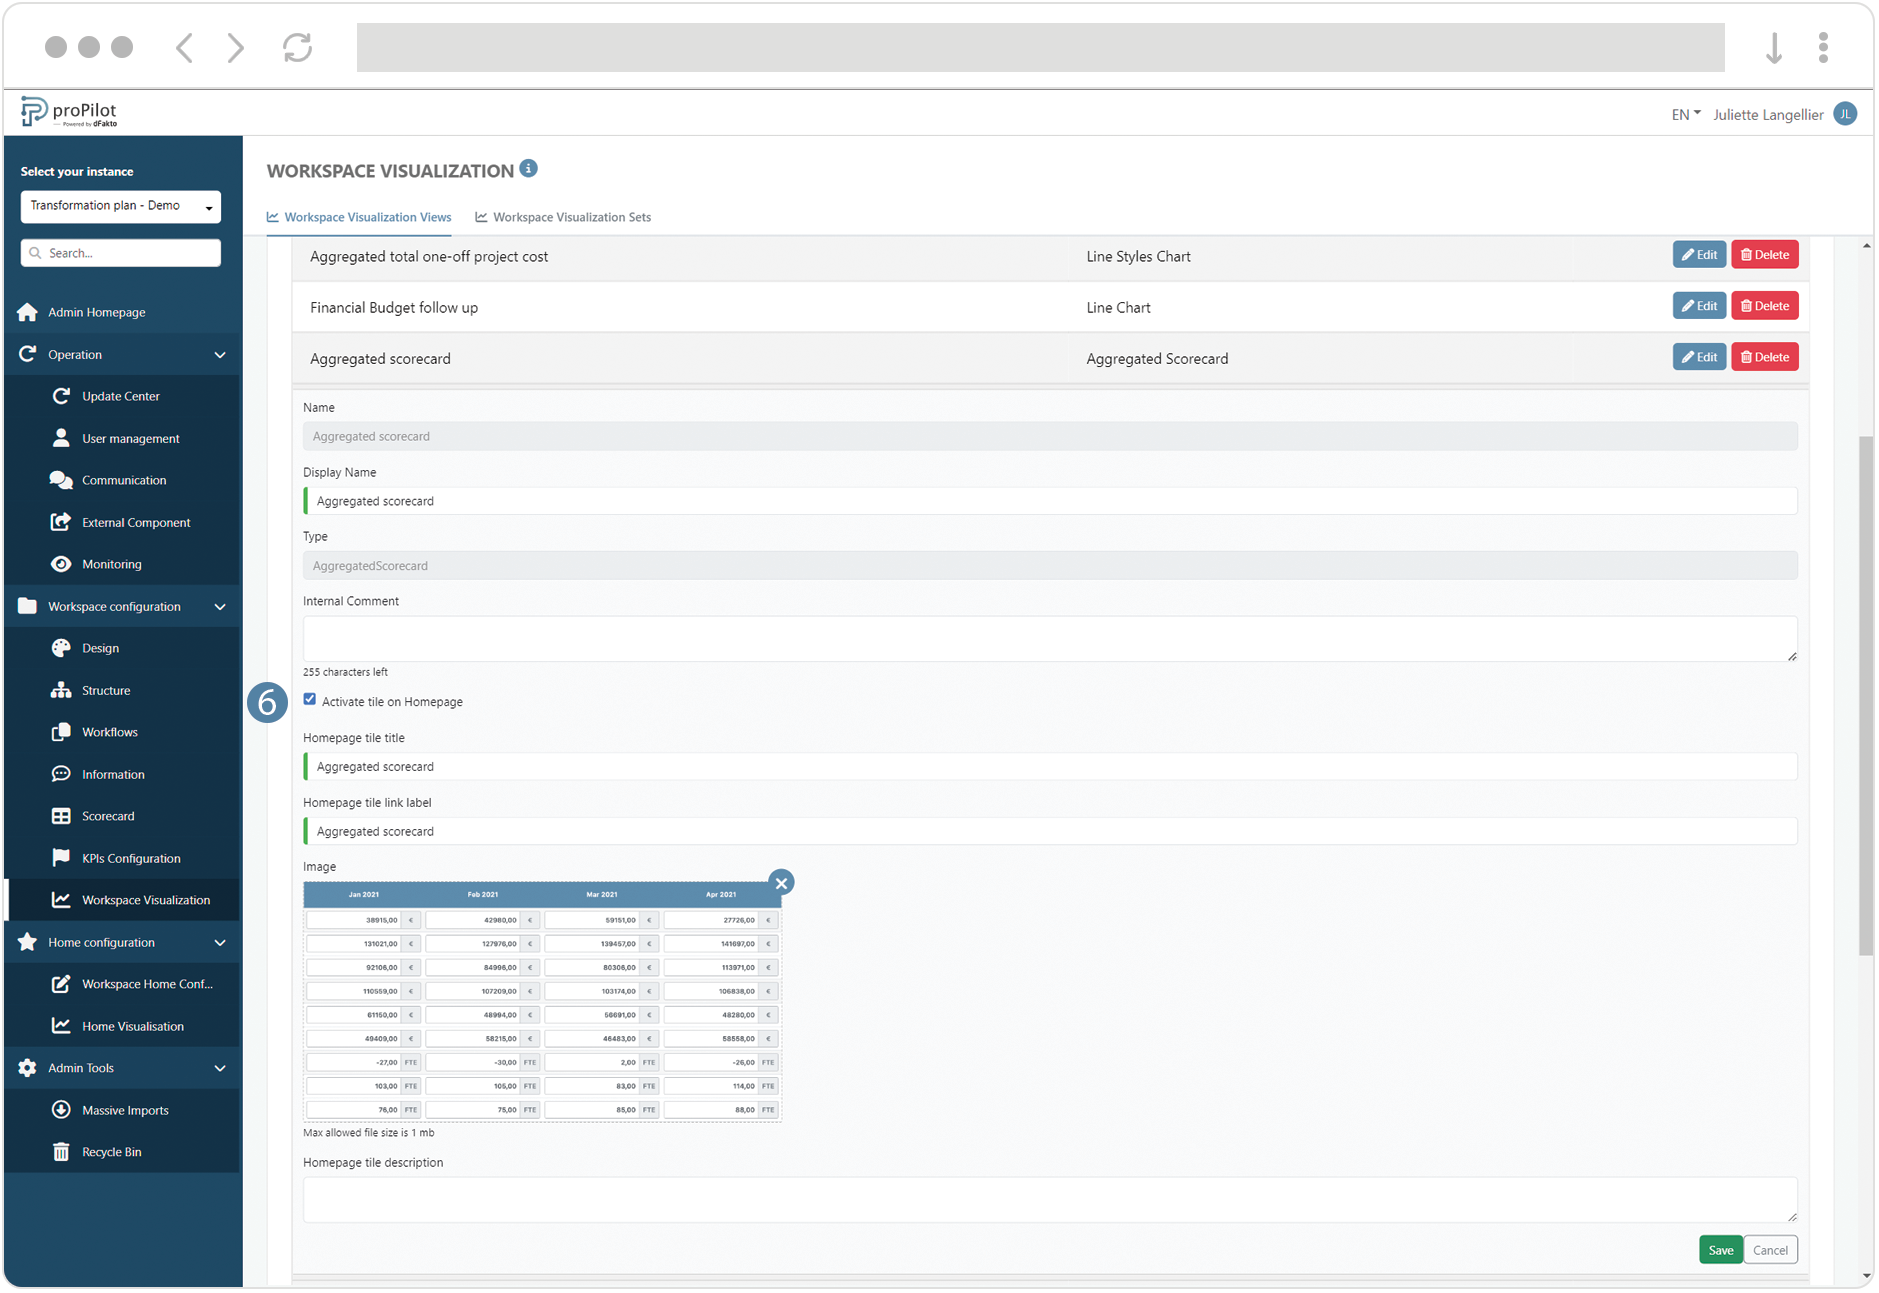
Save the visualization view, then click on the “Edit” button.
-
Configure the aggregated scorecard: enable the tile in the entity visualization homepage.