
Introduction
The proPilot home page allows you to view a consolidation of the information available in the "information" section of your workspace. You will thus benefit from a summary dashboard containing certain qualitative information.
This information will be made available level by level. It is linked to the information available for the workspaces of these levels.
Create and manage visualization for the home page.
Create an imagelist value count visualization
This visual allows you to display the number of times an image is present in the entities of the level.
For example, you can display the number of projects that currently have "sunny" weather.
-
In the left menu, select "home configuration" and then "home visualization".
-
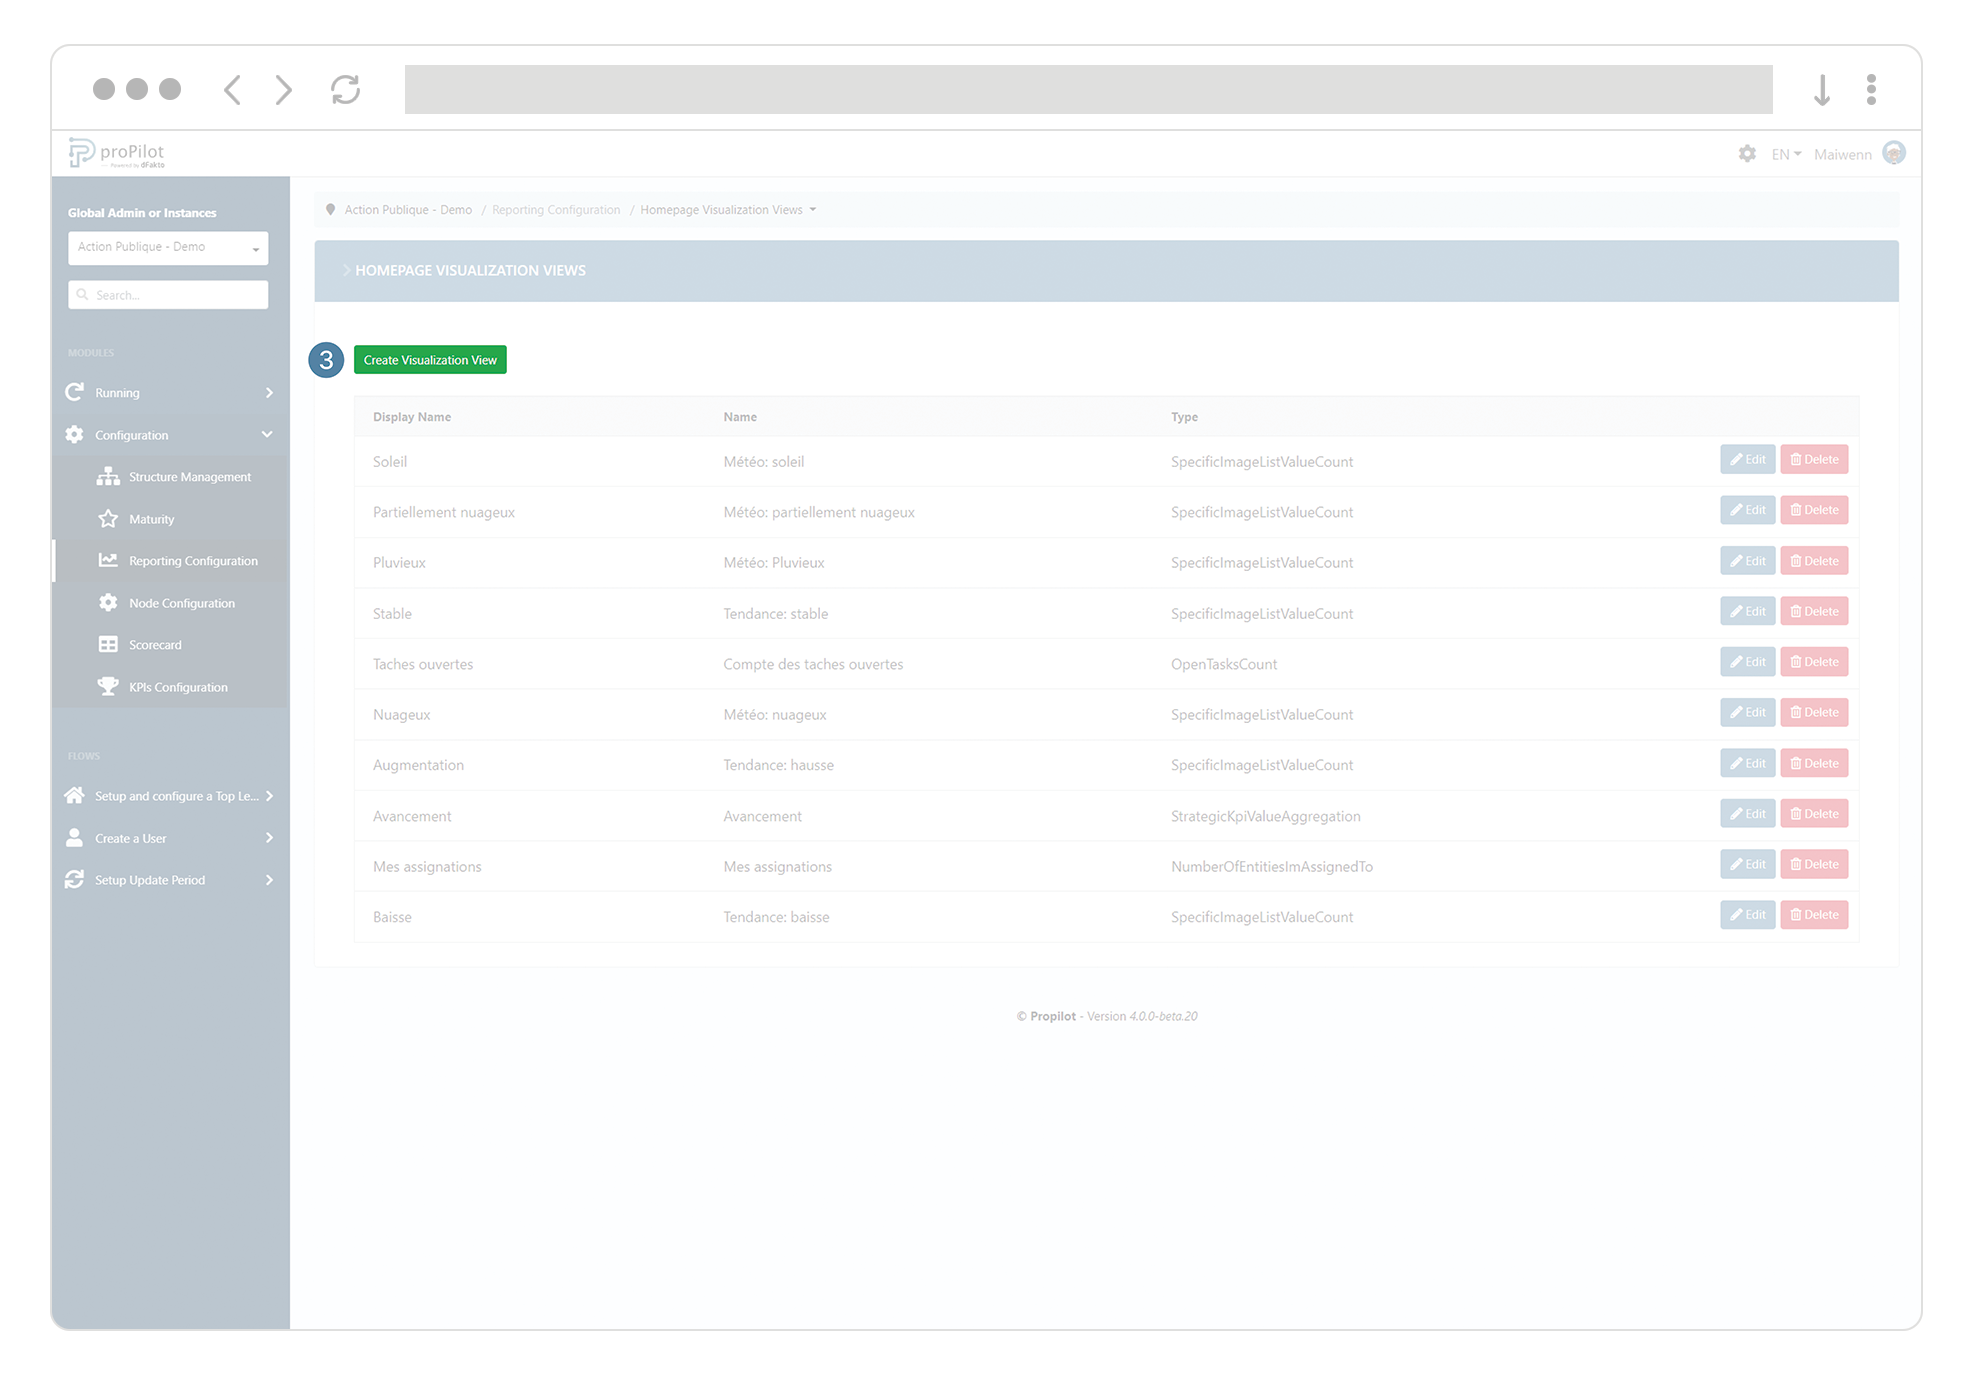
Then click on the "home visualization views" tab.
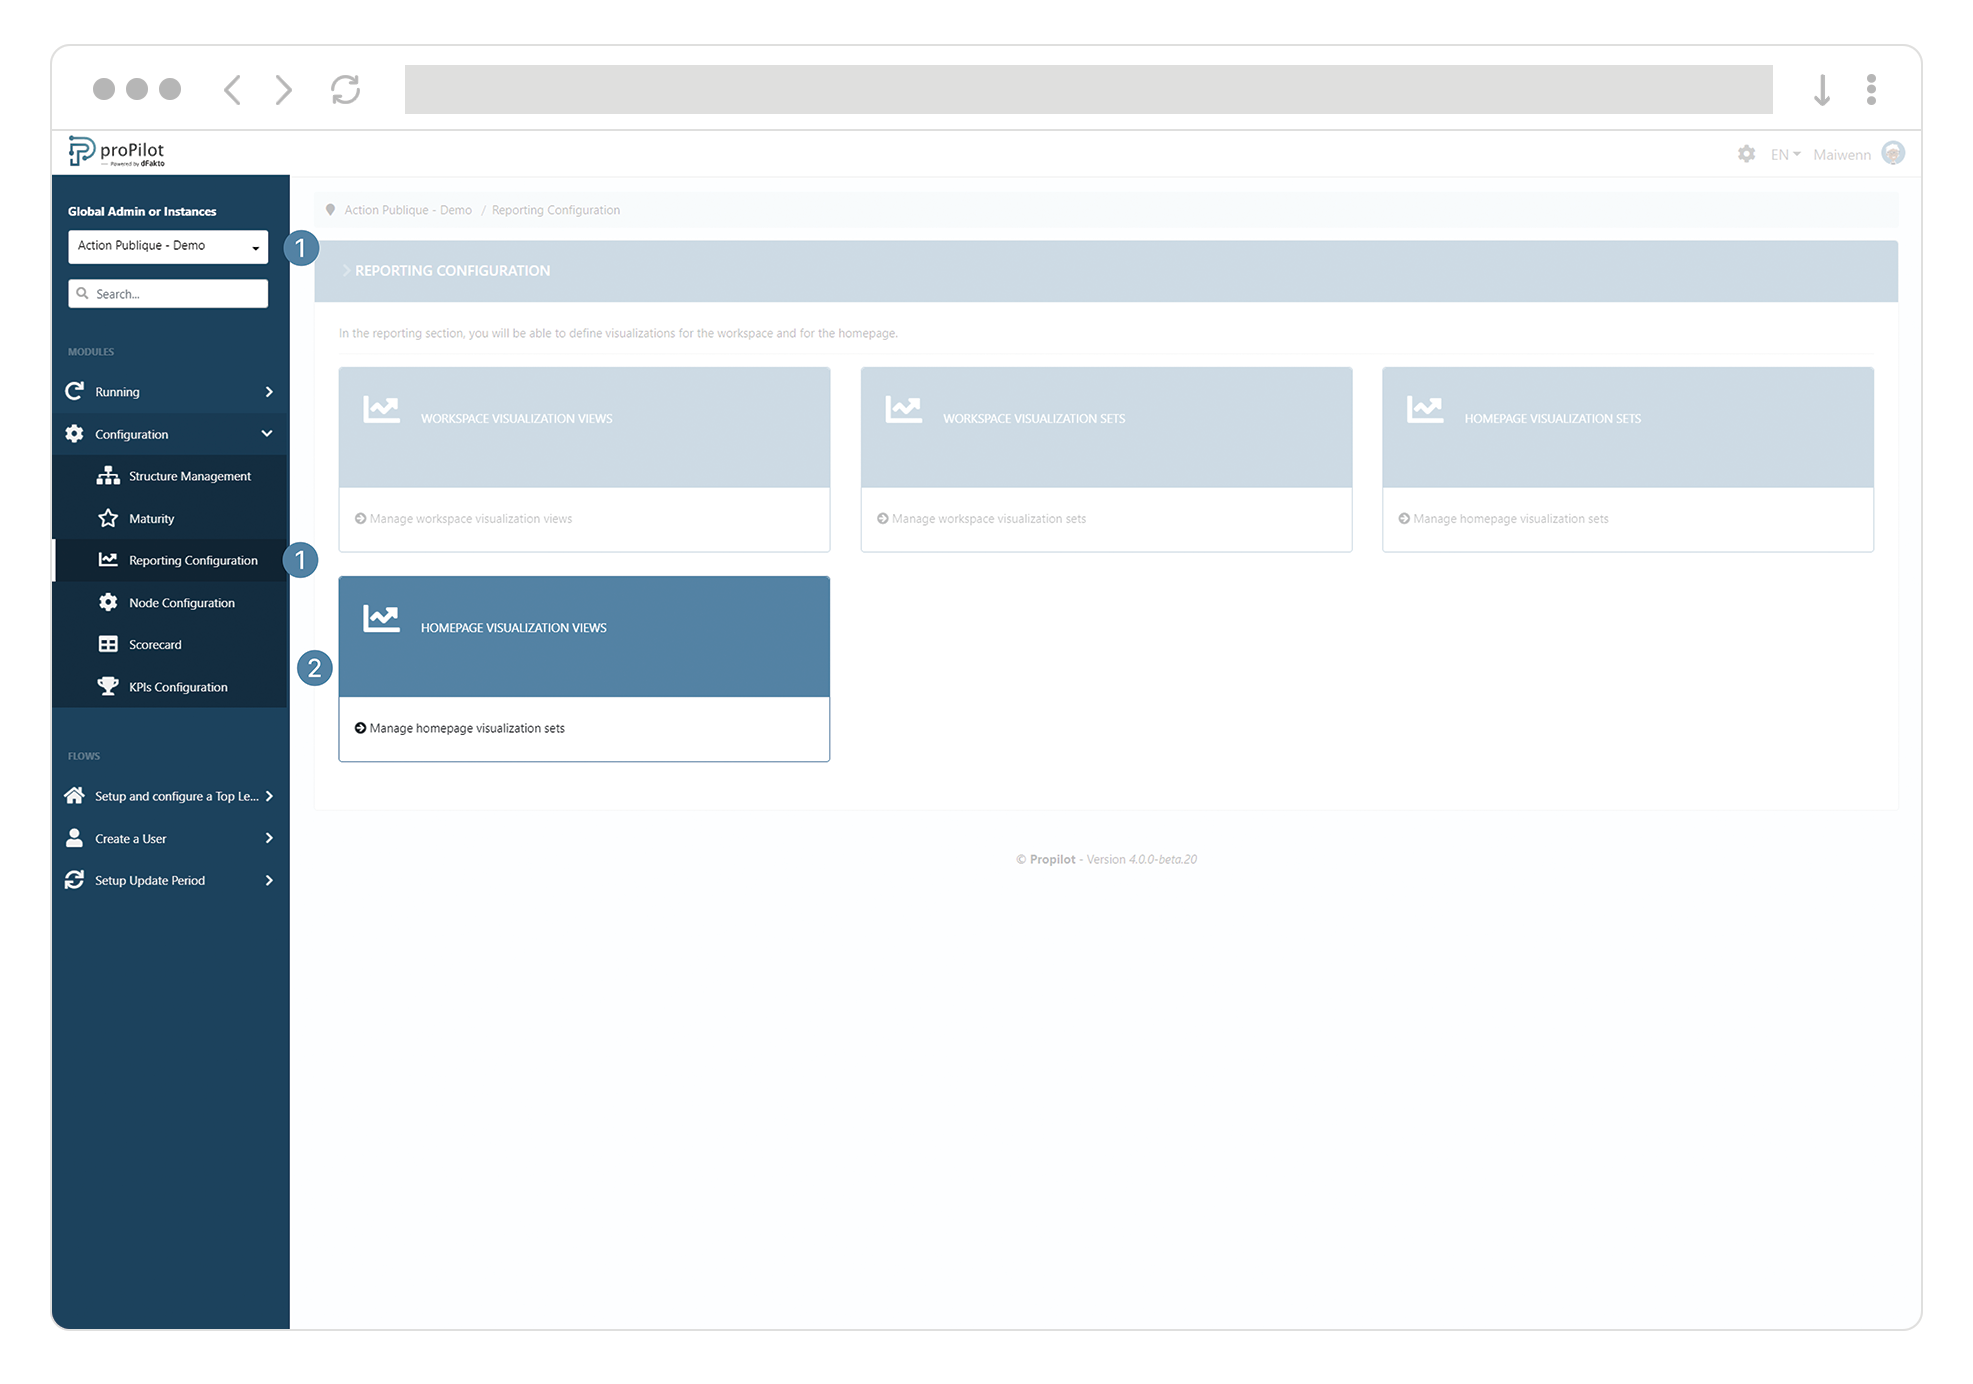
3. Click on the "create visualization view" button. A pop-up window will open.
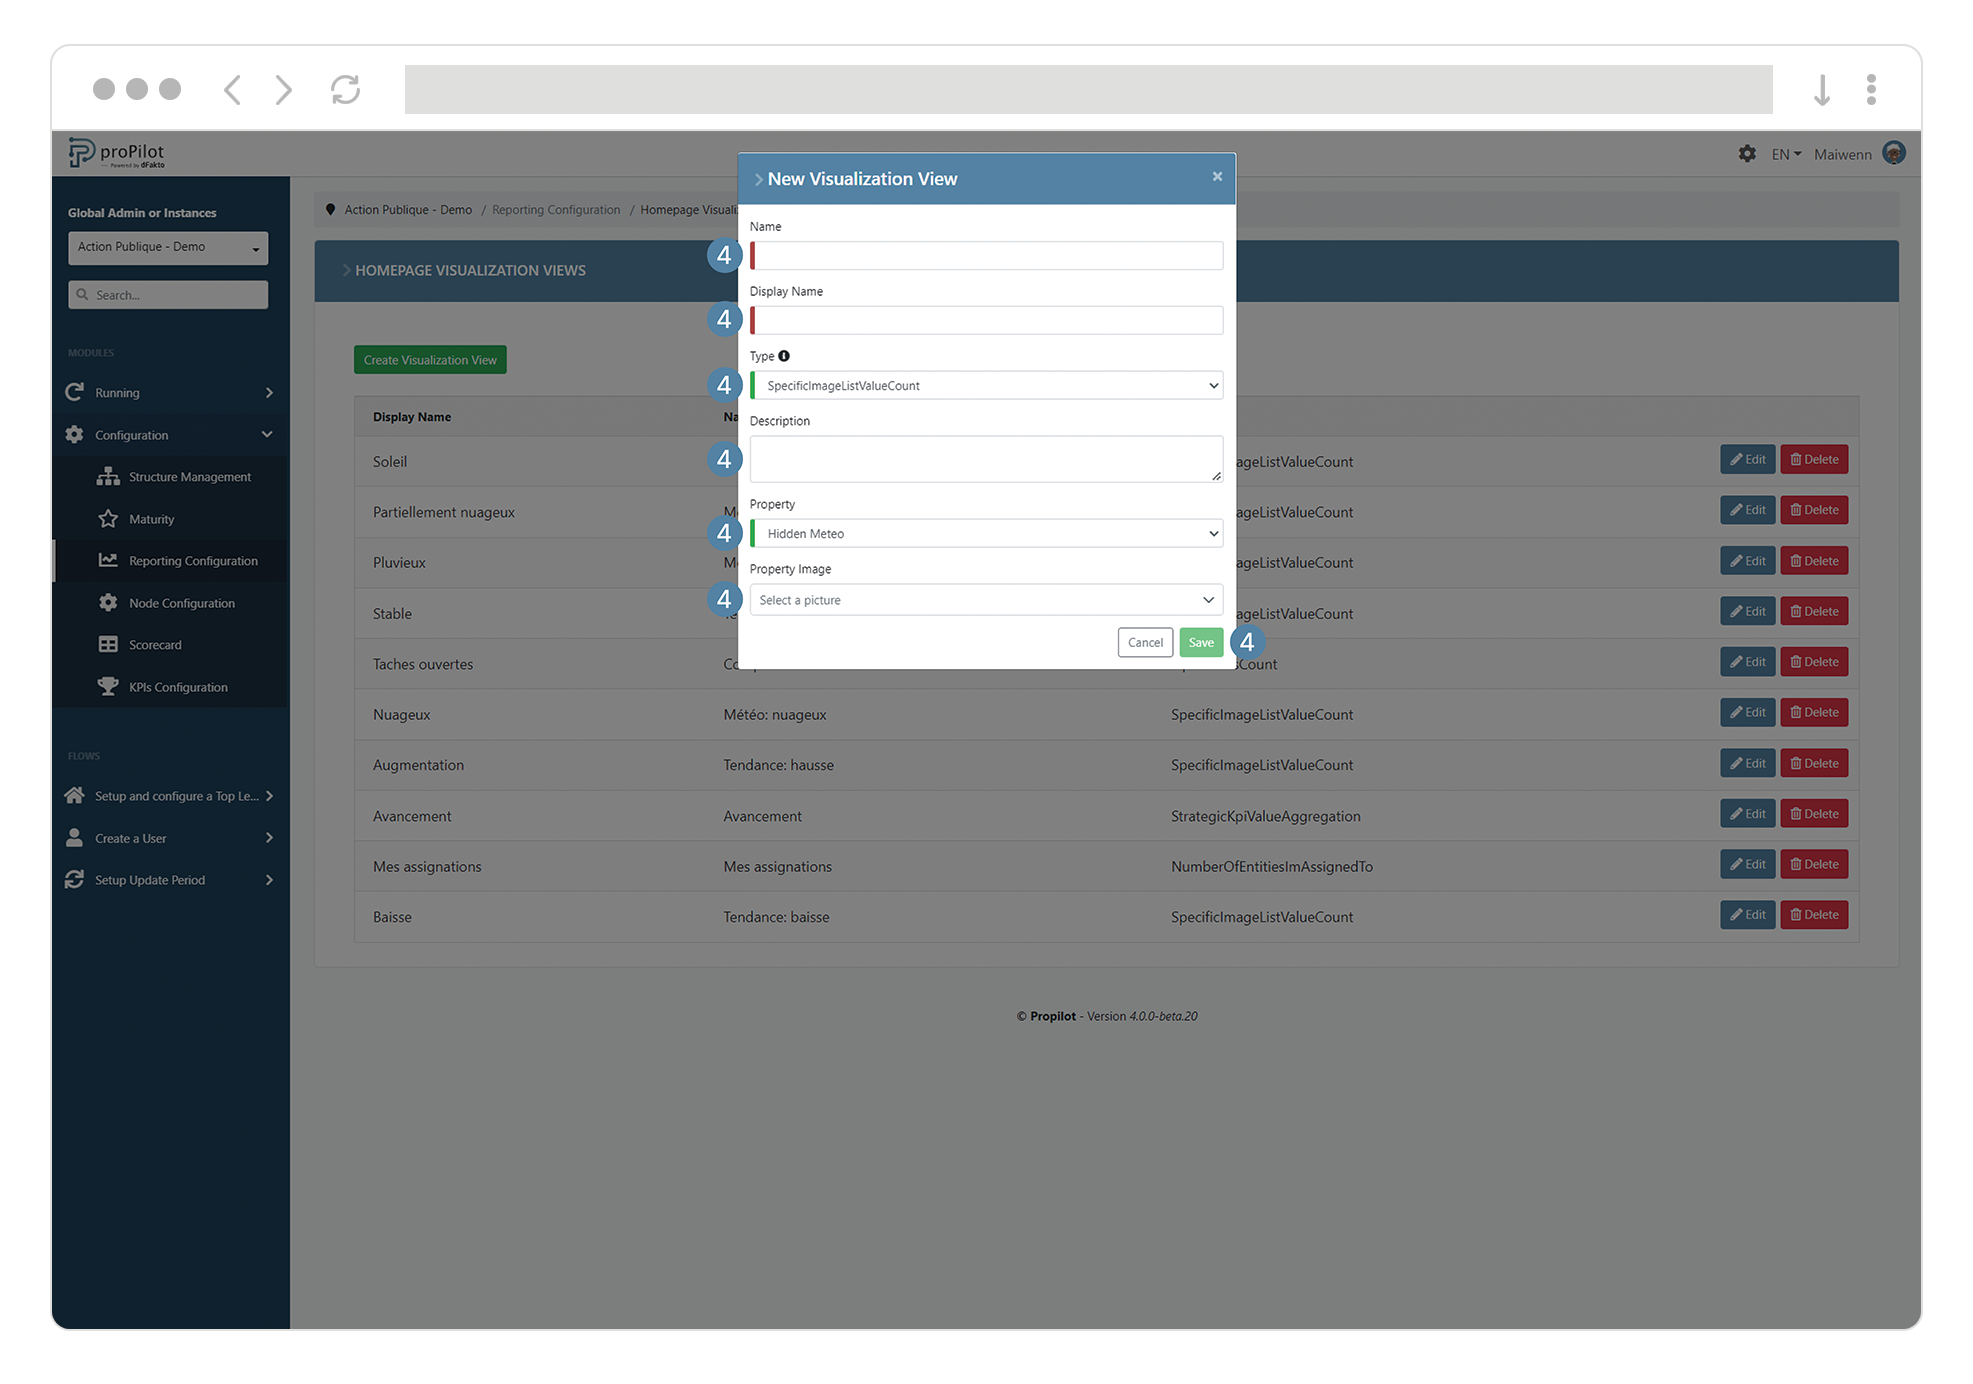
4. Fill in the following fields:
a. technical (name) and display name
b. Choose the type of visualization "specific image list value count"
c. Add a description if necessary
d. Choose the qualitative information you want to display
e. Choose the image you want to sum and display
Create a Sum of my assignments visualization
This visualization allows you to display the number of entities to which the user is assigned by level.
-
In the left menu, select "home configuration" and then "home visualization".
-
Then click on the "home visualization views" tab.
-
Click on the "create visualization view" button. A pop-up window will open.
-
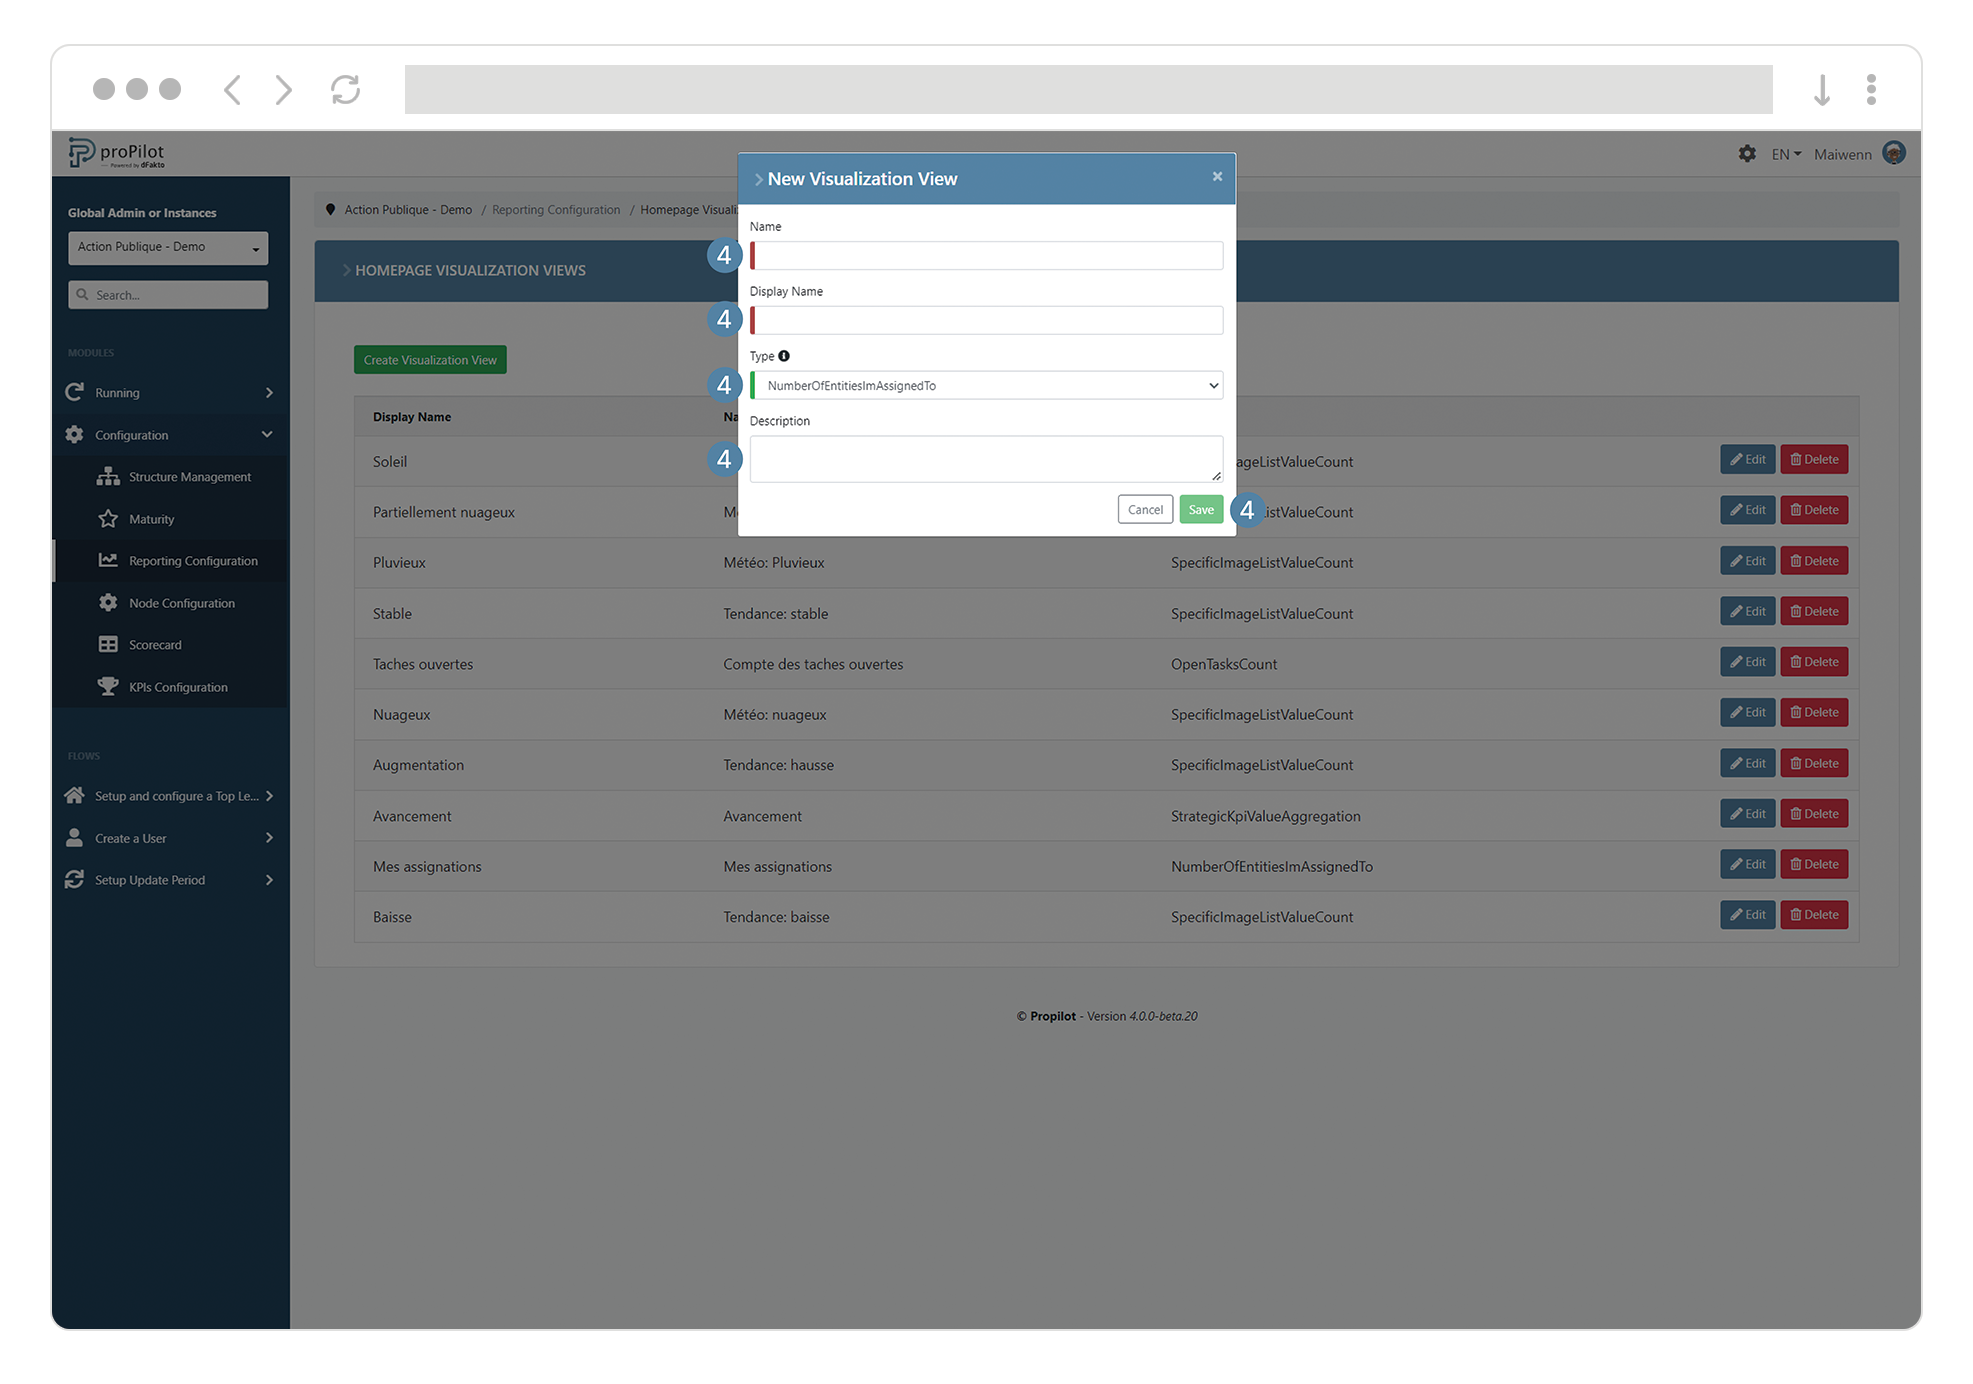
Fill in the following fields:
-
(technical) name and display name
-
Choose the type of visualization "number of entities I’m assigned to"
-
Add a description if necessary
-
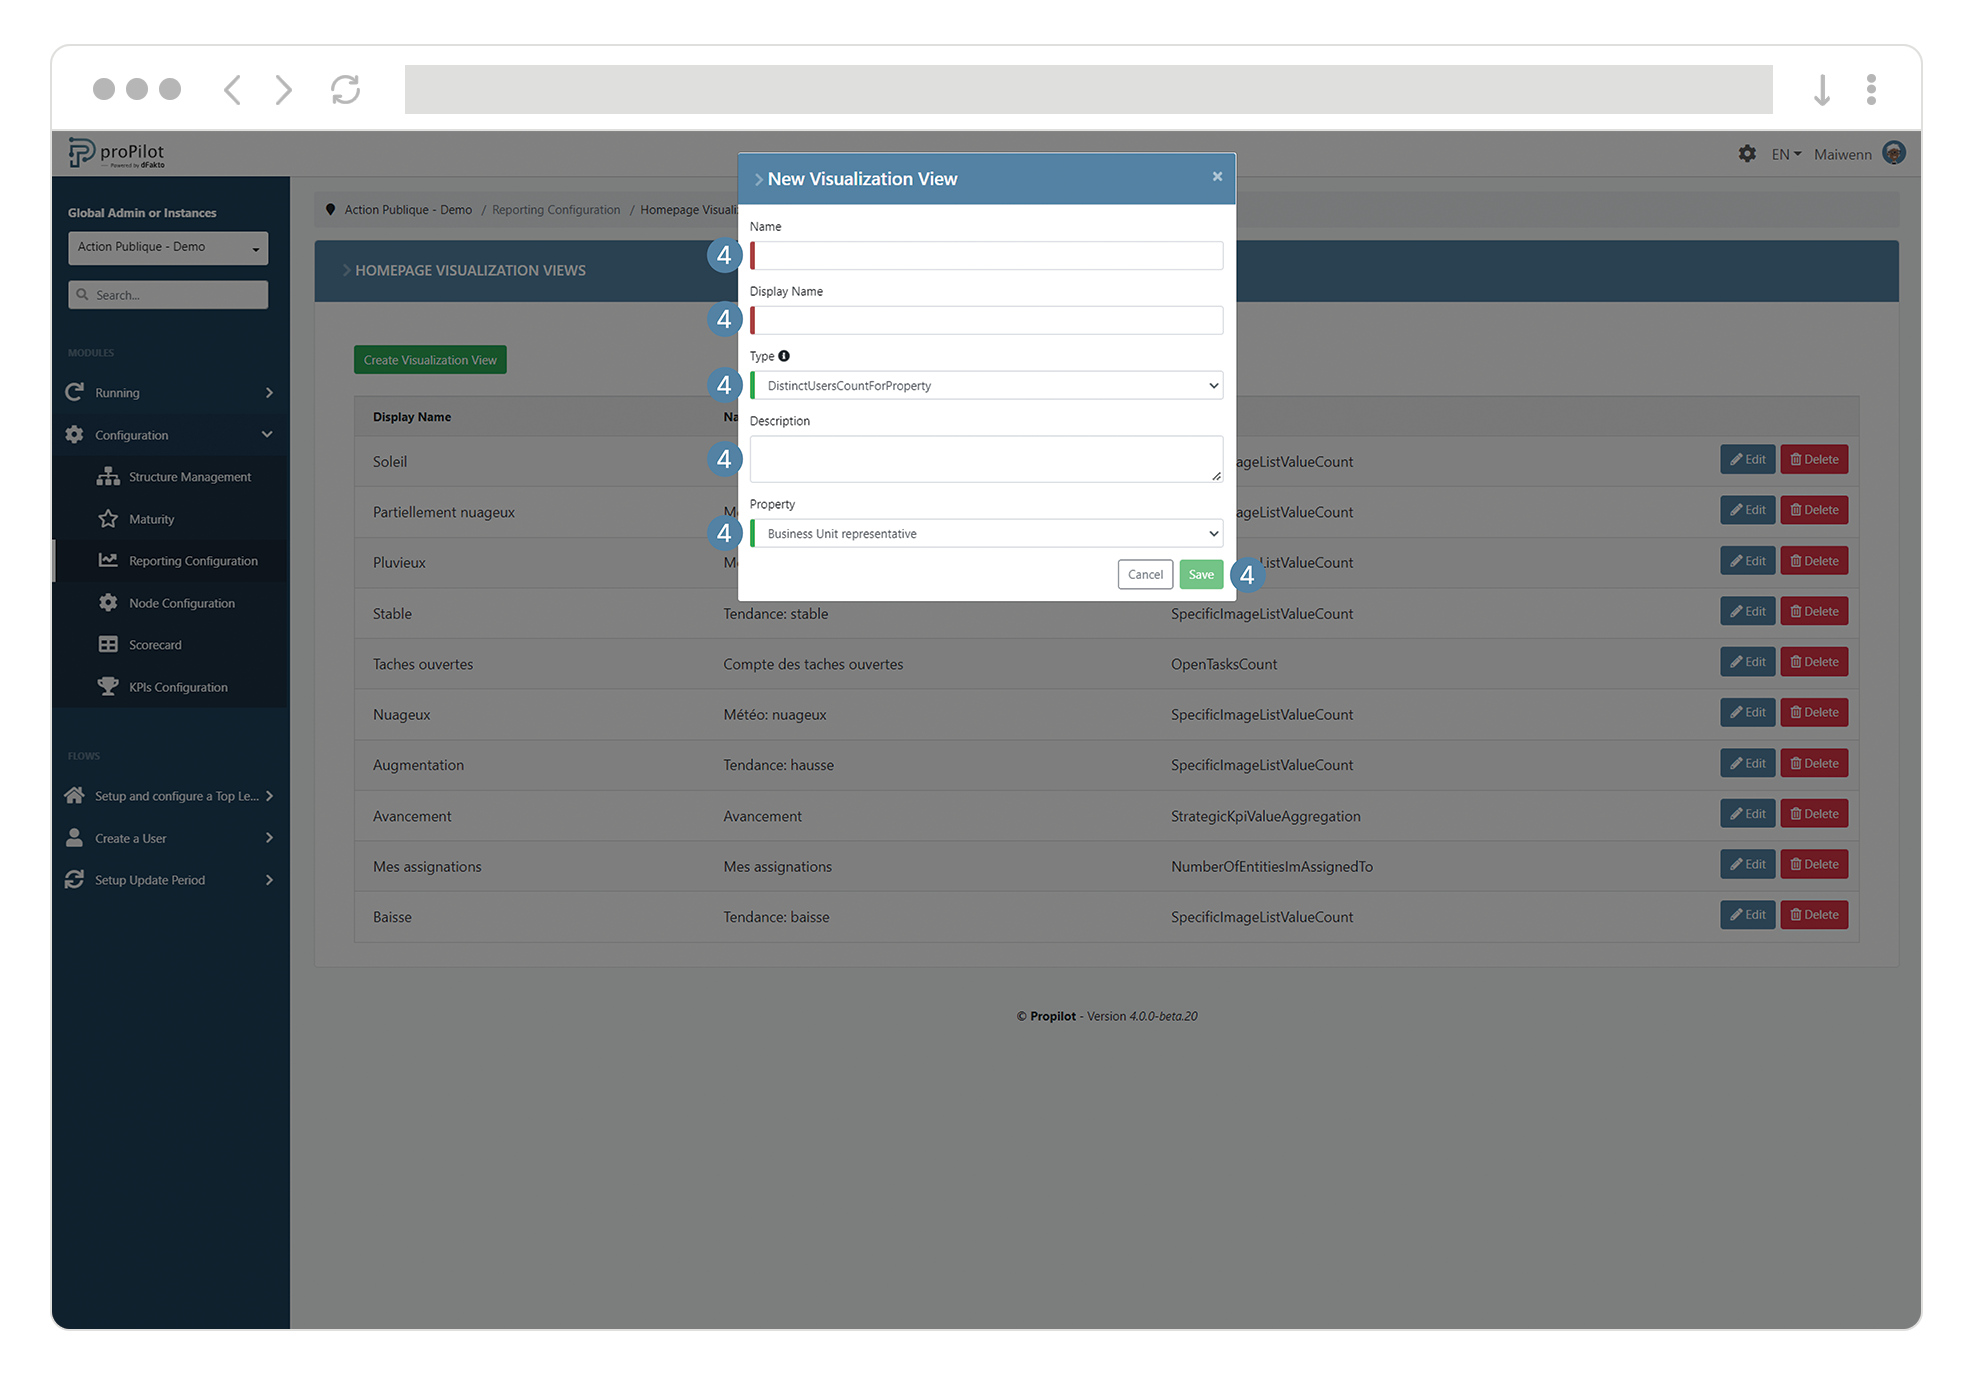
Create a users sum visualization
This module allows you to display a summary of the number of users assigned to a certain level of responsibility. This calculation is based on a user or group type of information. For example, you can display the number of people assigned in the "Project manager" information.
-
In the left menu, select "home configuration" and then "home visualization".
-
Then click on the "home visualization views" tab.
-
Click on the "create visualization view" button. A pop-up window will open.
-
Fill in the following fields:
-
(technical) name and display name
-
Choose the type of visualization "distinct users count for property"
-
Add a description if necessary
-
Choose the type of users (qualitative information) you want to sum and display
-
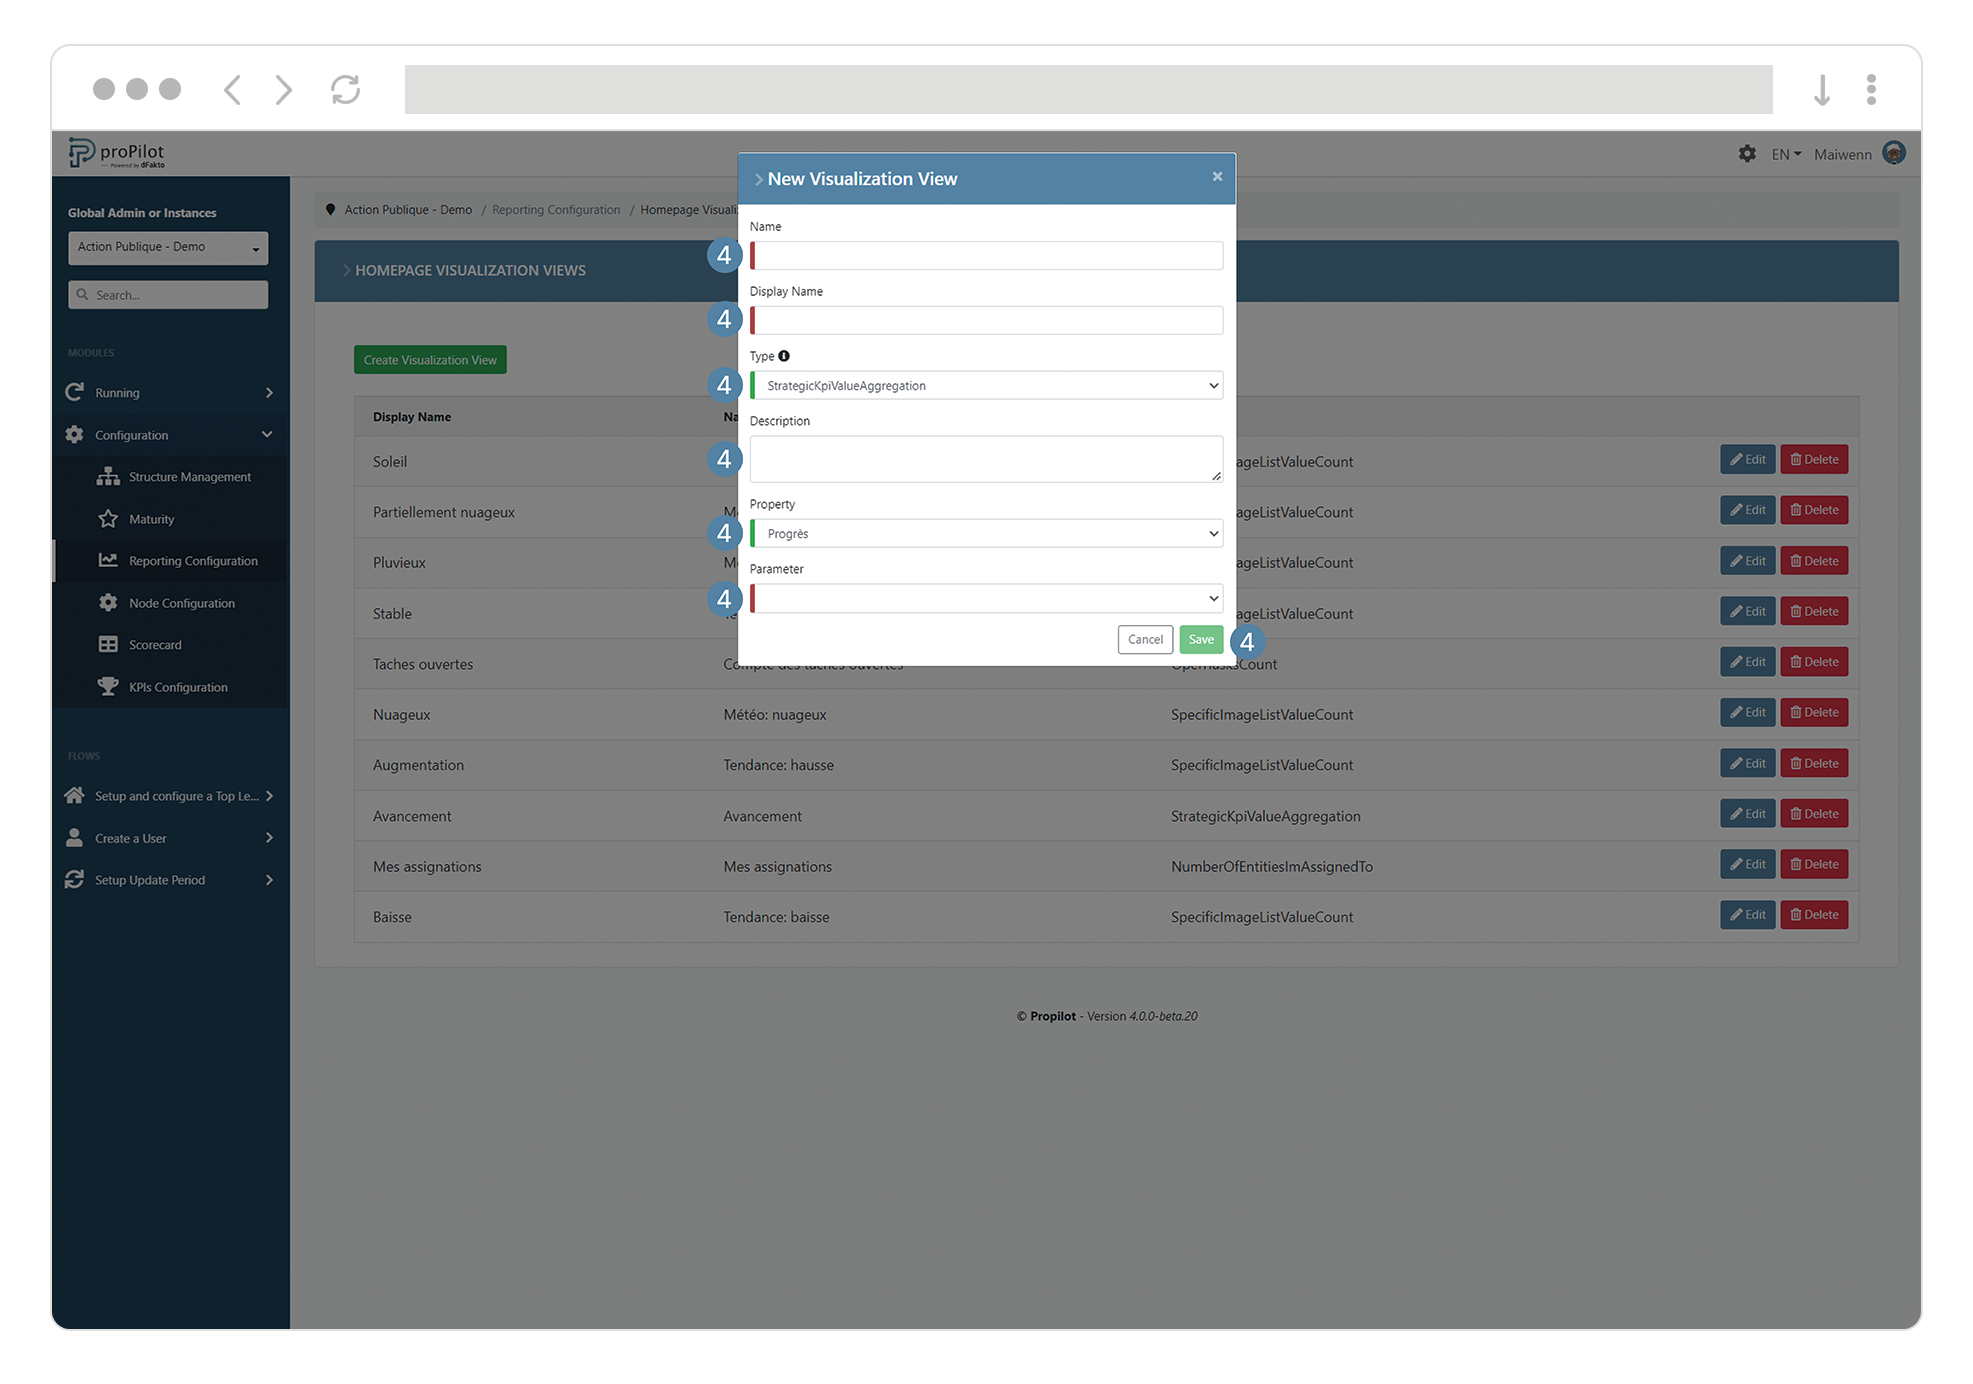
Create a strategic KPIs visualization
This module allows you to display the sum or an average for a strategic KPI of the level.
-
In the left menu, select "home configuration" and then "home visualization".
-
Then click on the "home visualization views" tab.
3. Click on the "create visualization view" button. A pop-up window will open.
4. Fill in the following fields:
a. (technical) name and display name
b. Choose the type of visualization "strategic KPI value aggregation"
c. Add a description if necessary
d. Choose the strategic KPI (qualitative information) that you want to calculate and display
e. Choose the type of calculation (sum or arithmetic average)
Create a Number of open tasks visualization
This module allows you to display a summary of the number of tasks currently open.
-
In the left menu, select "home configuration" and then "home visualization".
-
Then click on the "home visualization views" tab.
-
Click on the "create visualization view" button. A pop-up window will open.
-
Fill in the following fields:
-
(technical) name and display name
-
Choose the type of visualization "open tasks count".
-
Add a description if necessary
-

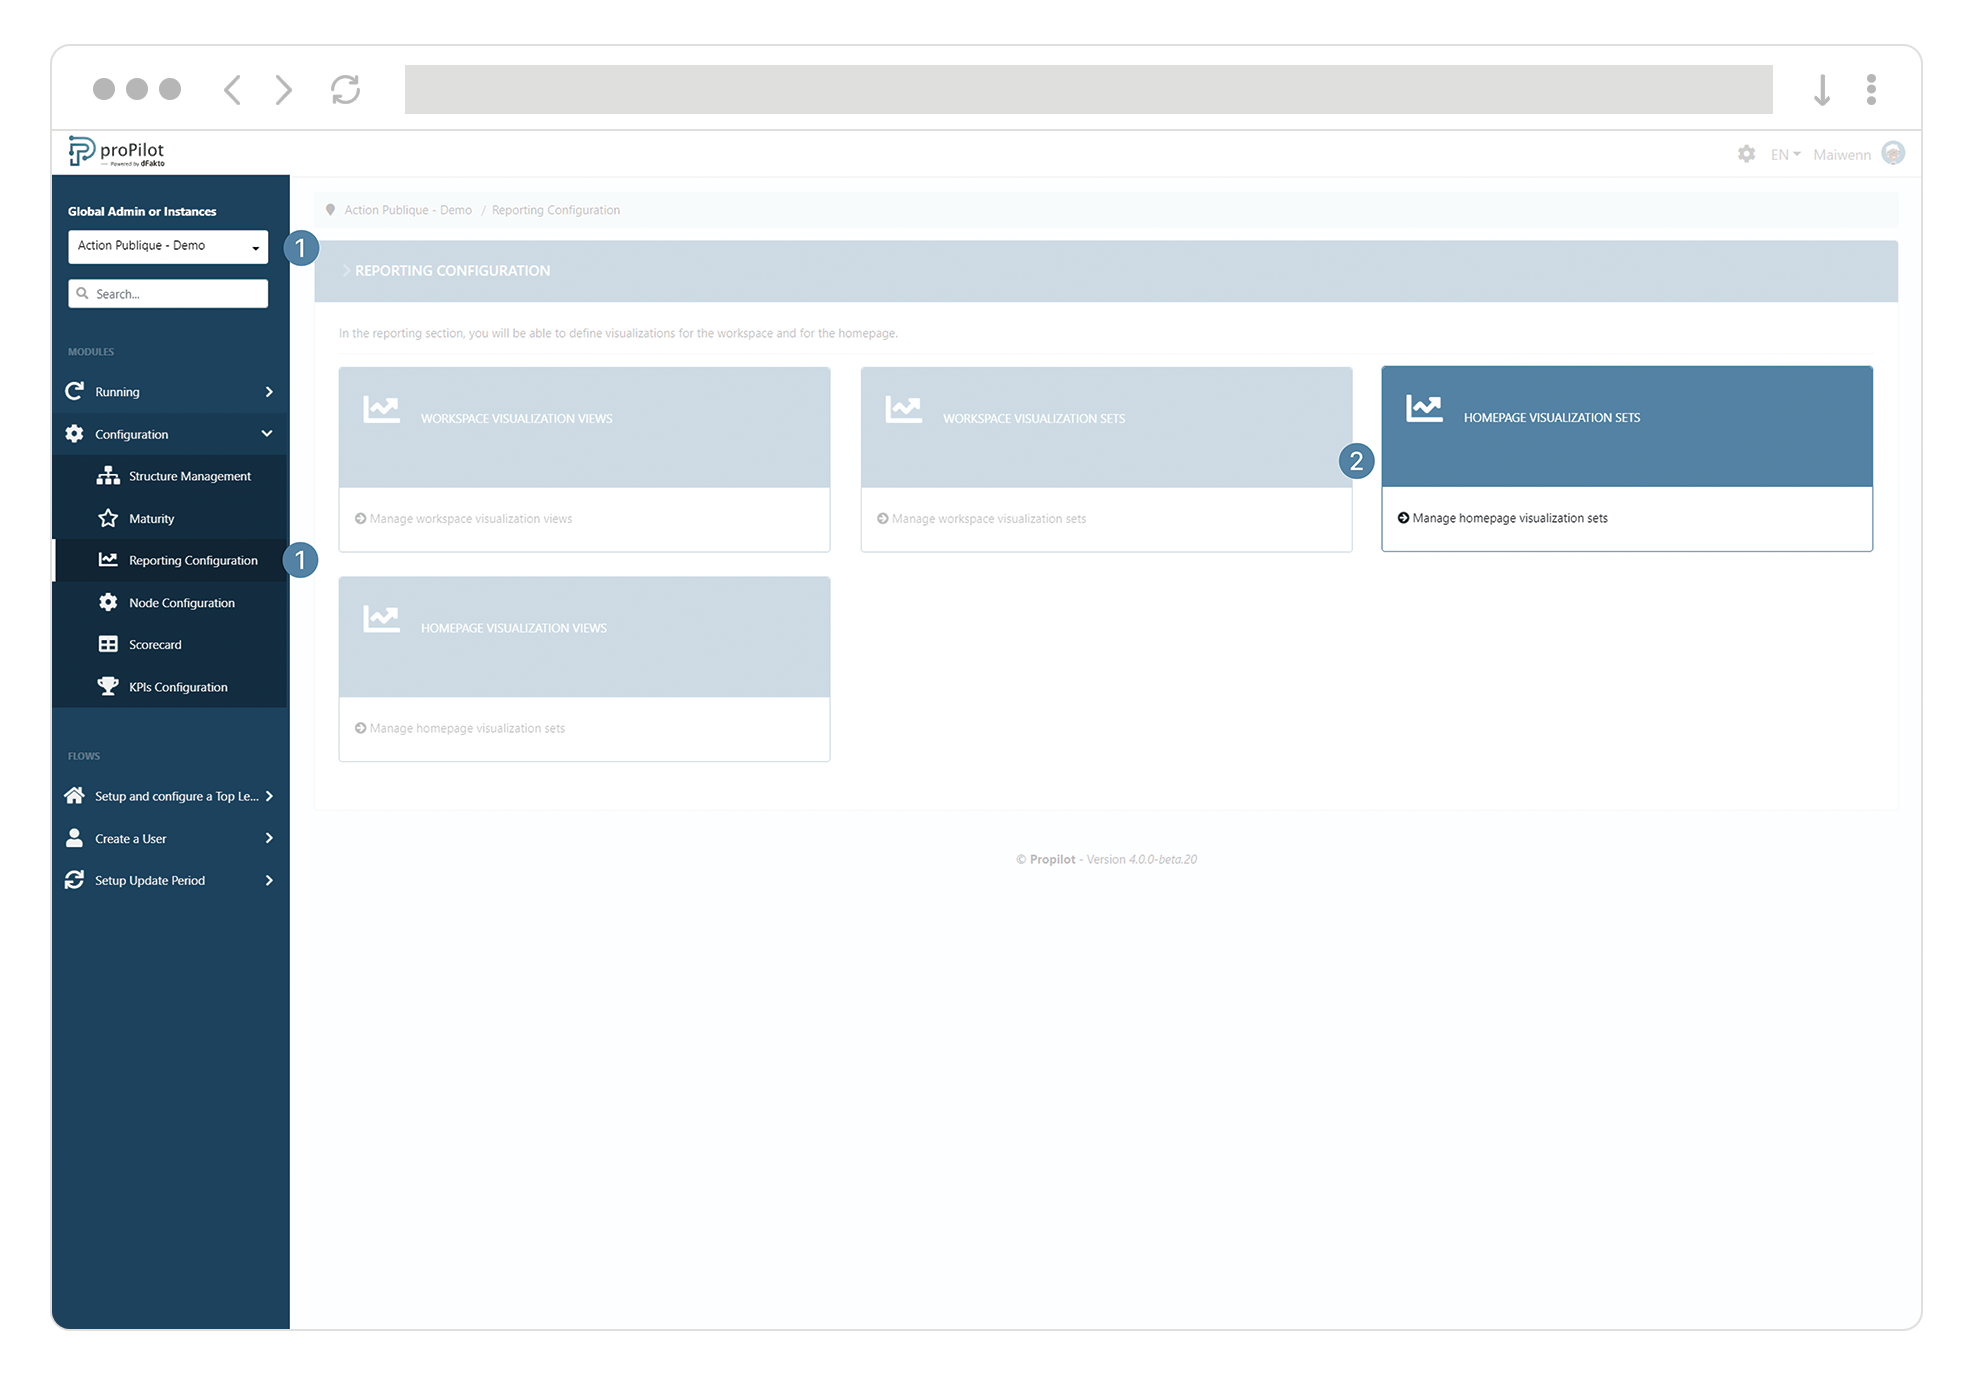
Create and manage a homepage visualisation set
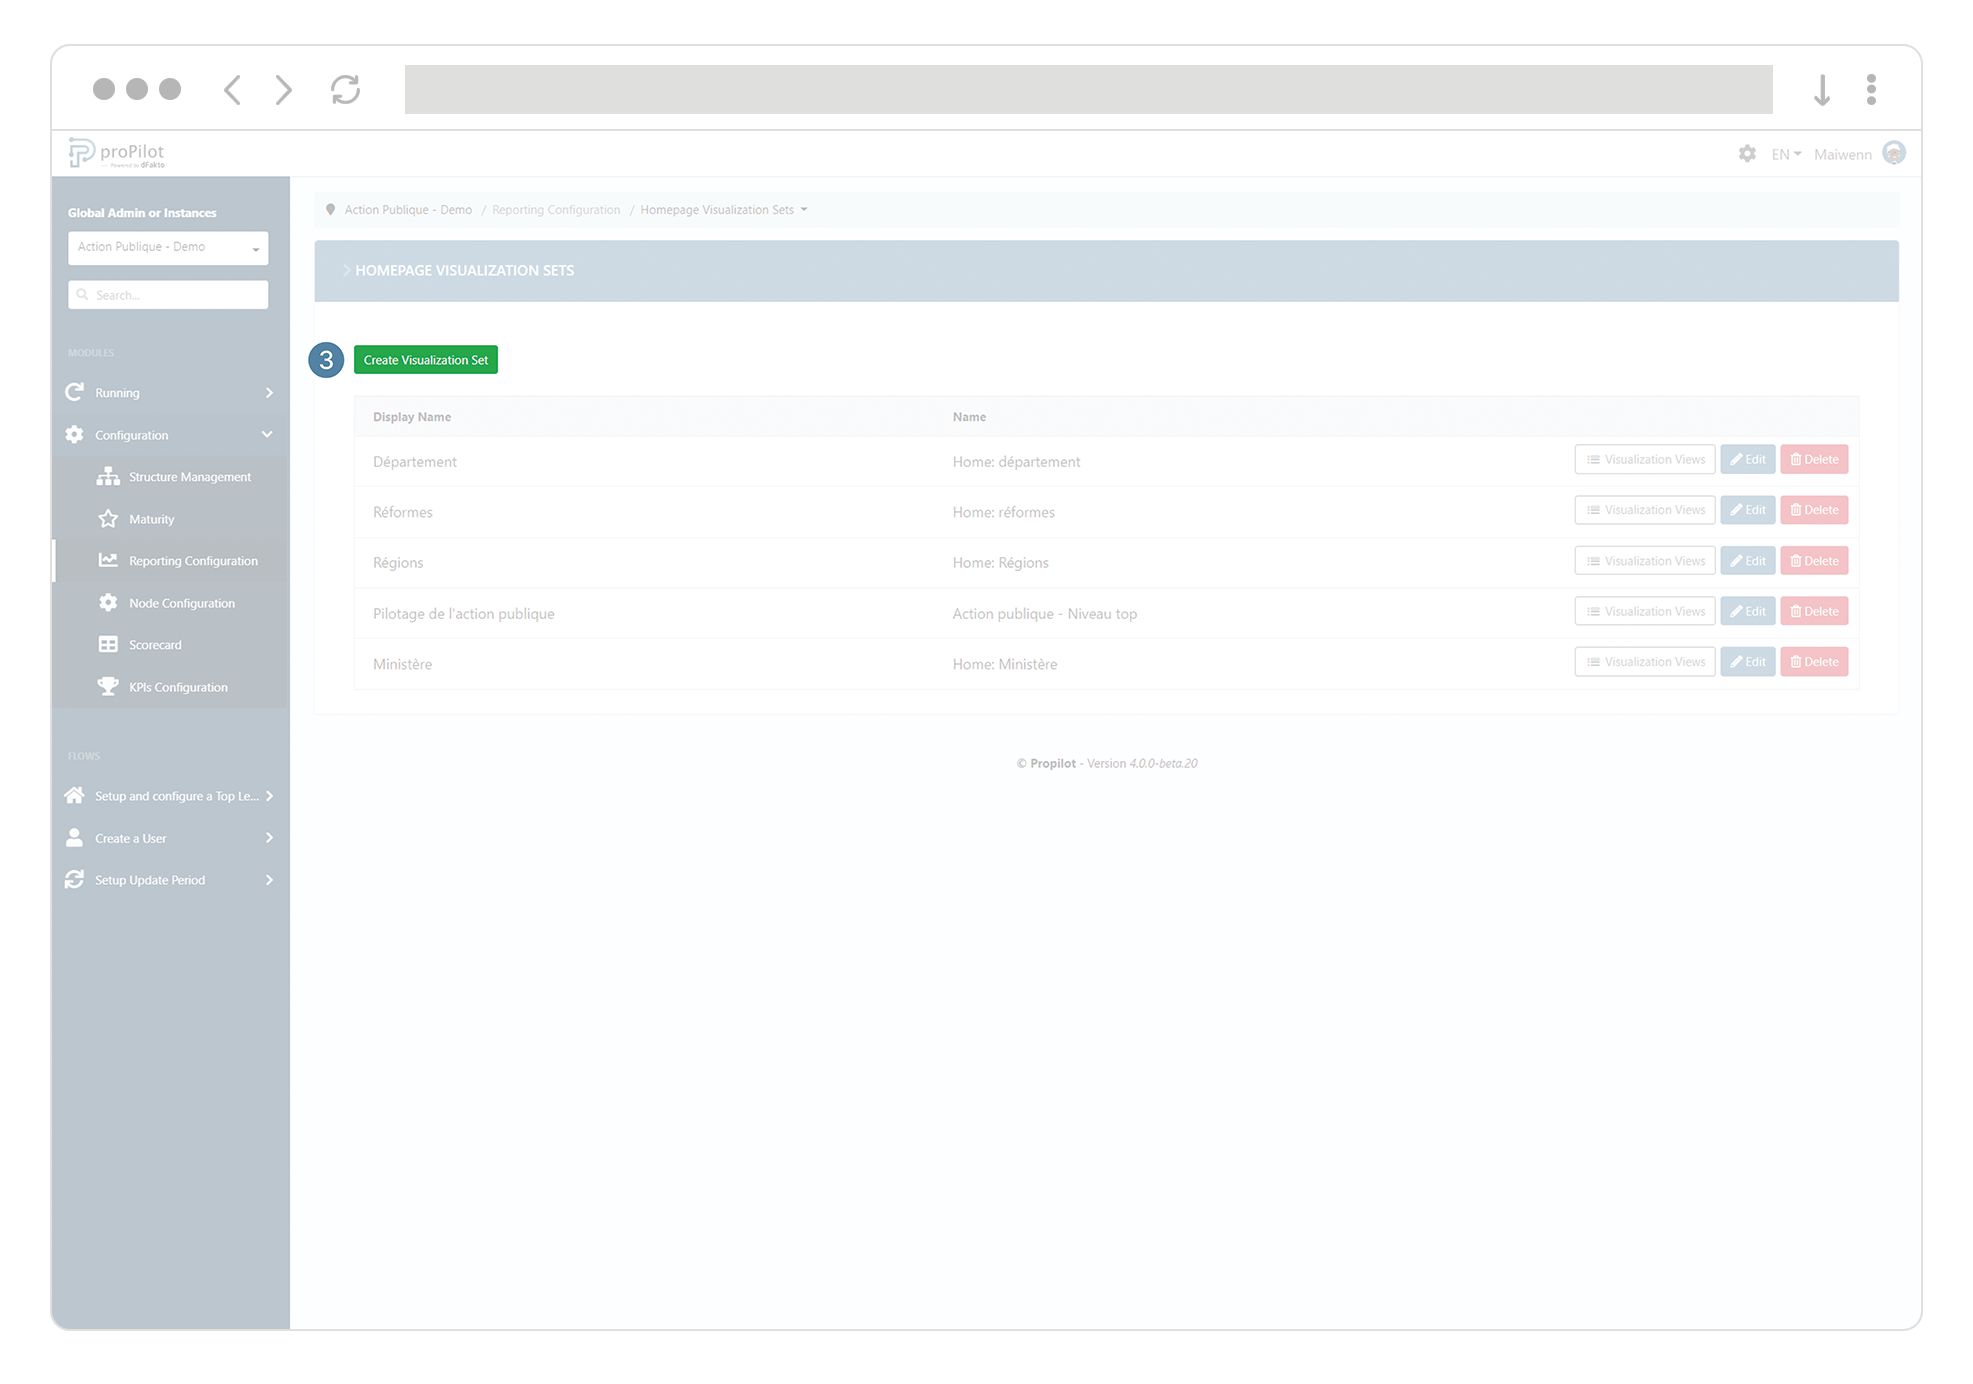
Create a visualizations set for your home page
-
In the left menu, select "home configuration" and then "home visualization".
-
Then click on the "home visualization sets" tab.
-
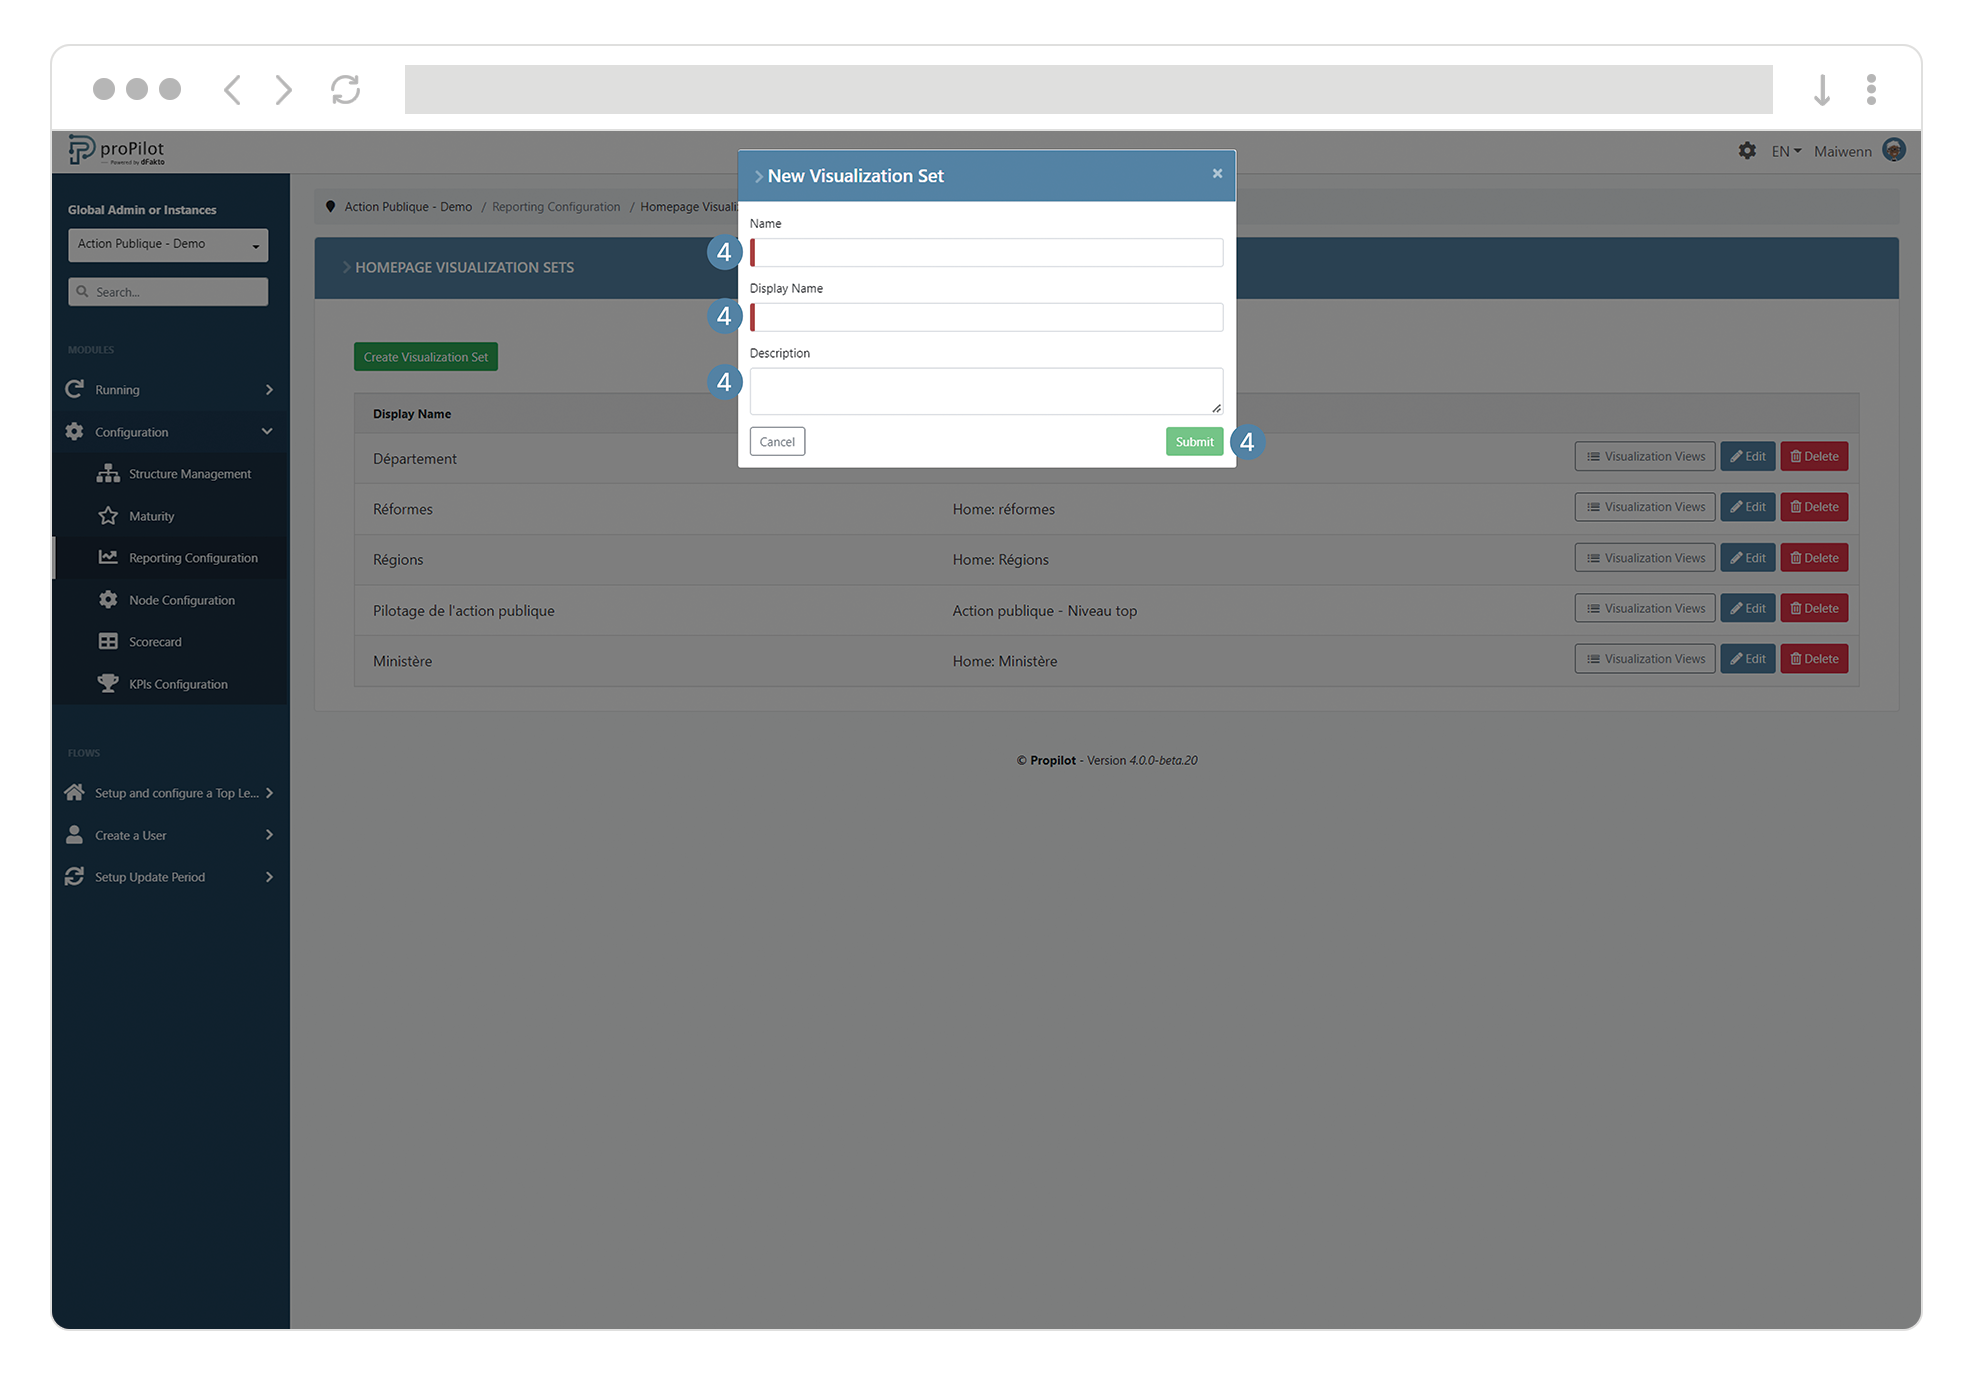
Click on "create visualization set". A pop-up window opens.
-
Fill in the fields "(technical) name" and "display name".
Add visual(s) to your homepage visualization set
-
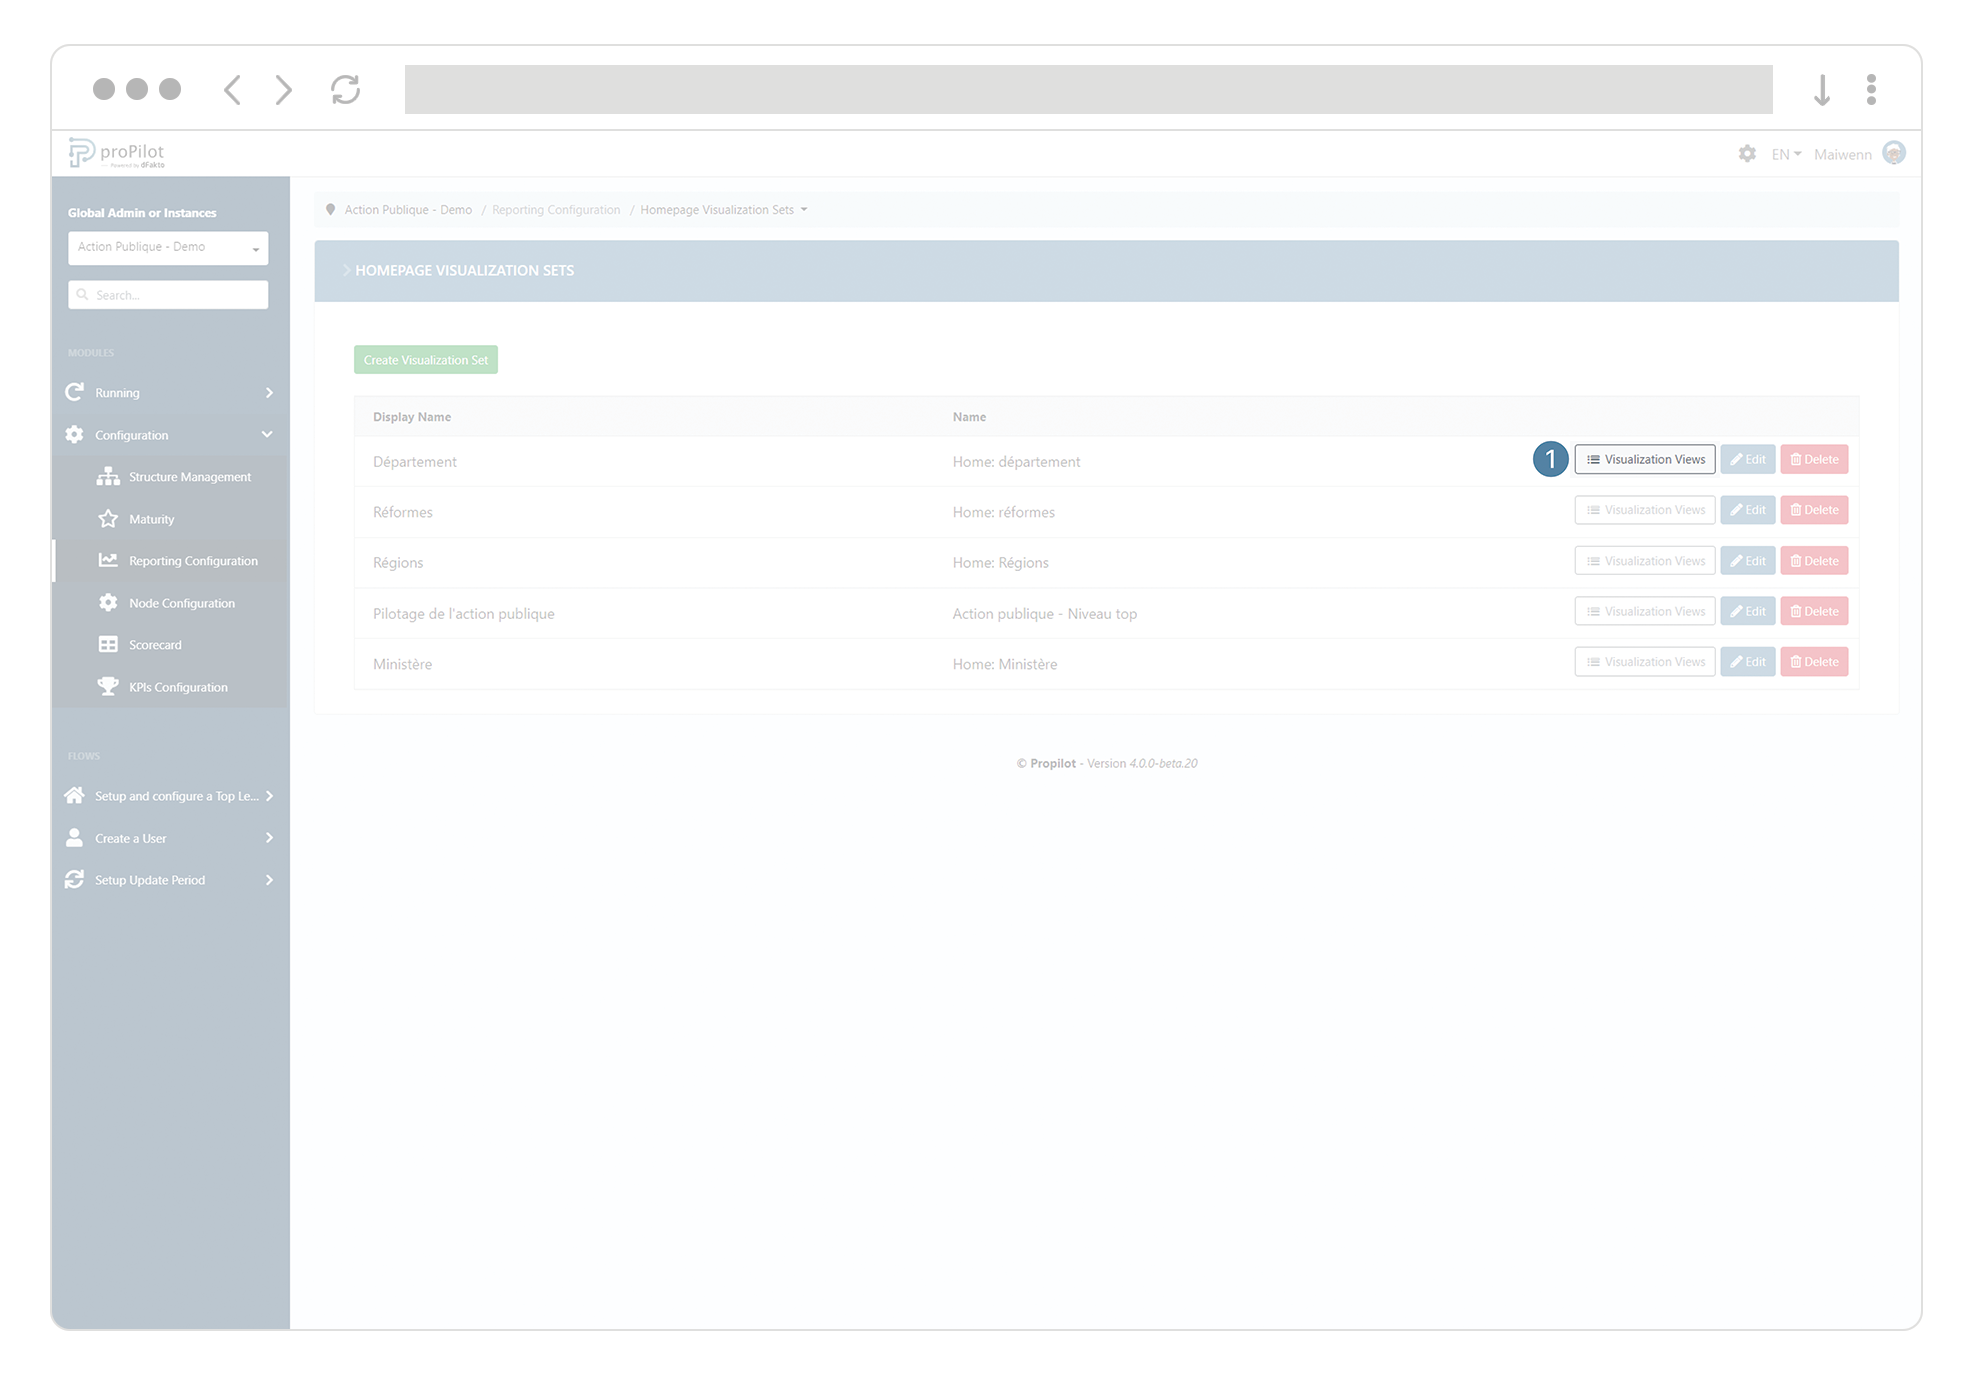
Click on the "Visualization views" button, a drop-down list opens. Here you have to select the appropriate information set for your homepage visualization set.
-
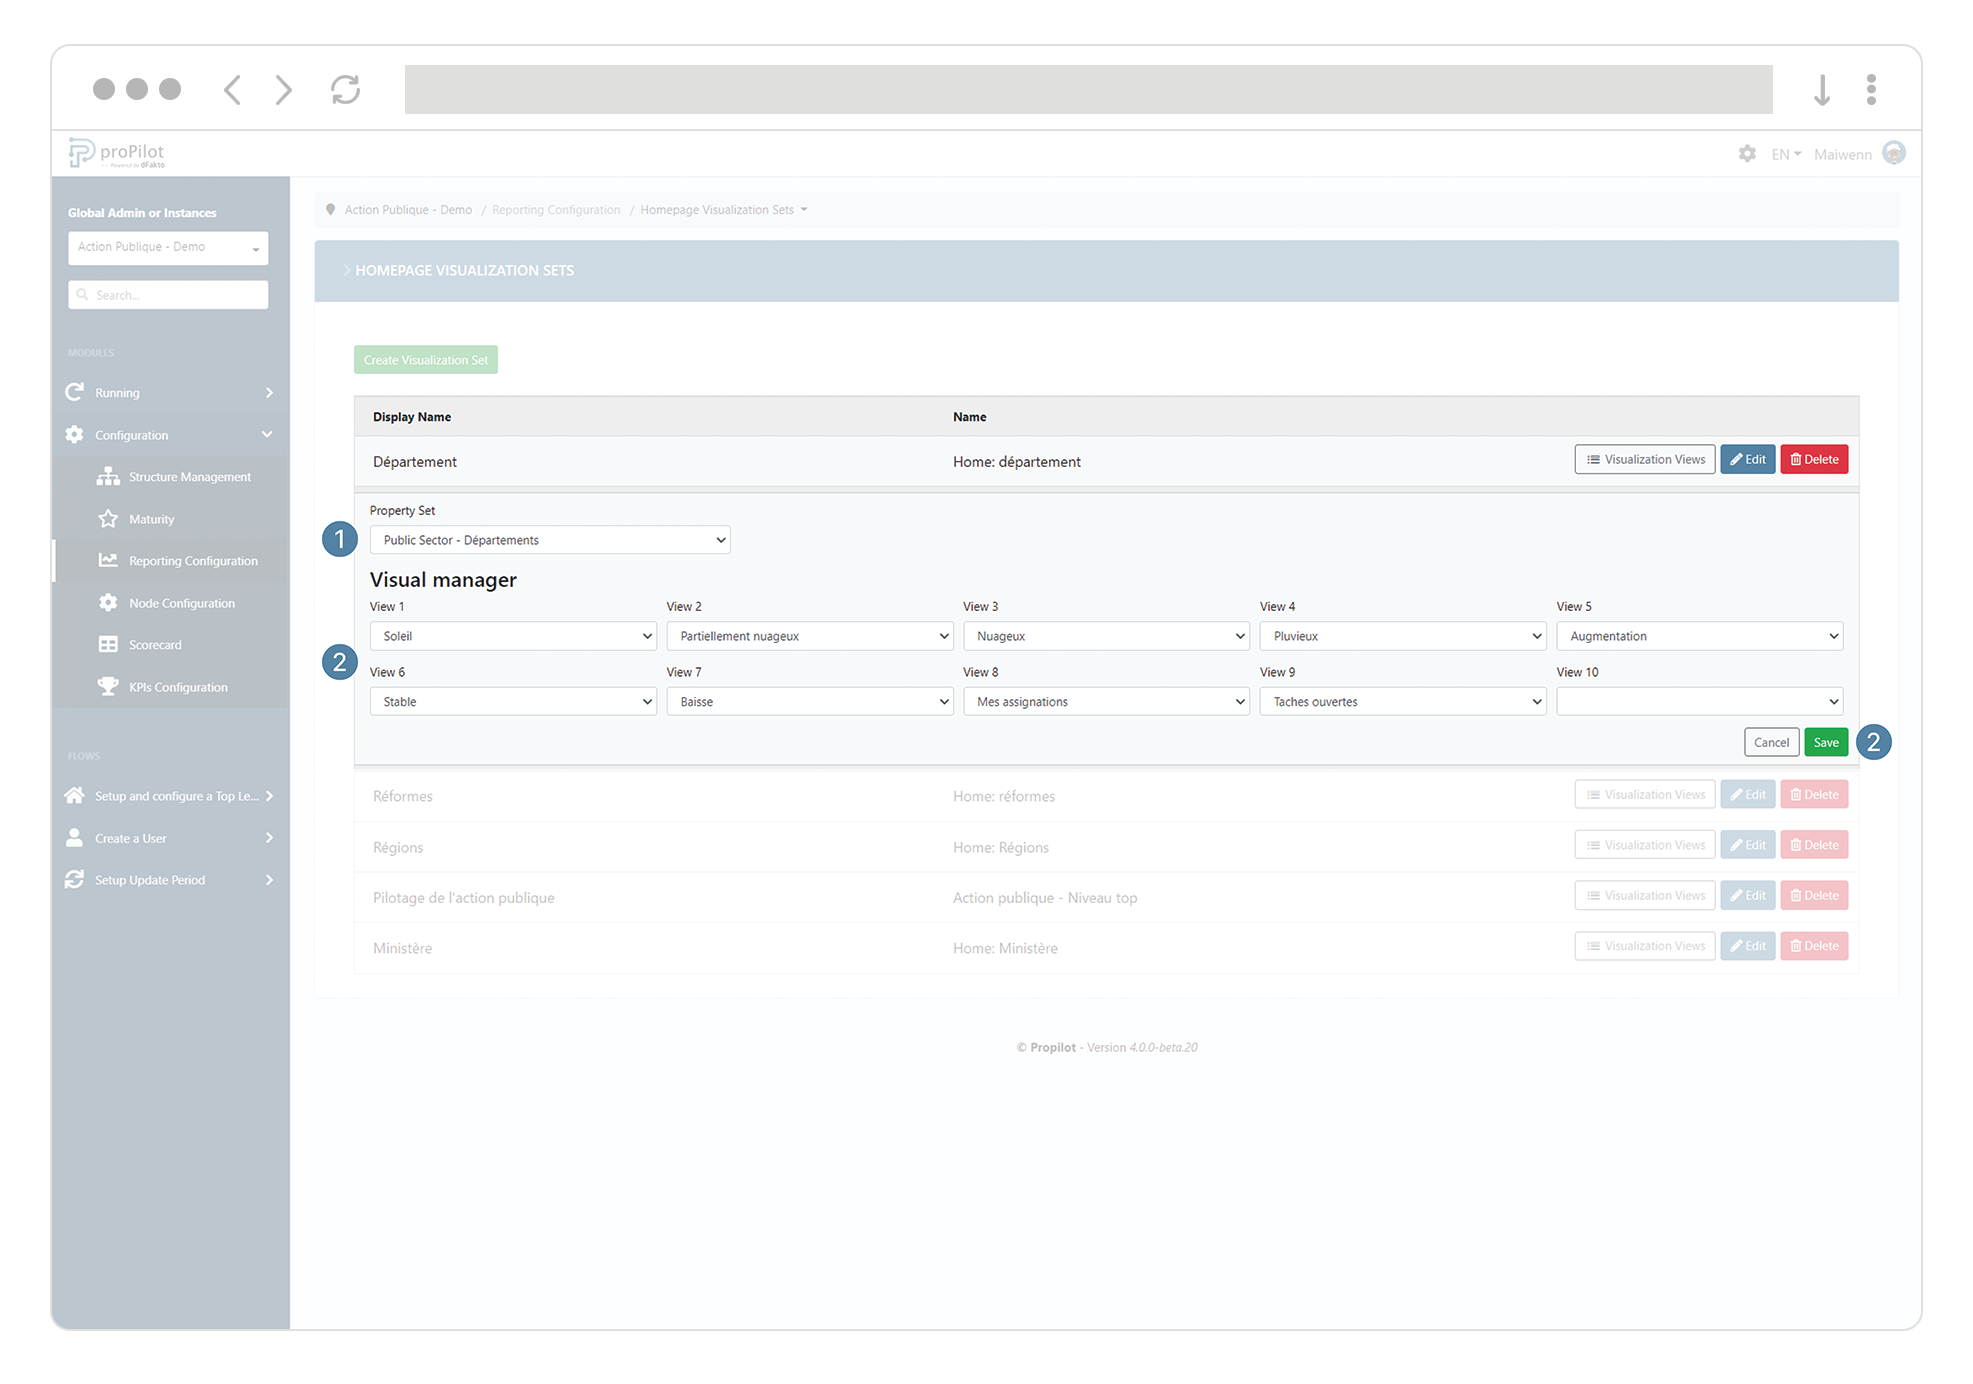
Define for which level the homepage visualisation set will be used. Select the information set from the dropdown list.
-
In the "Visual Manager" section, select up to 10 consolidated information sets that you would like to appear in the proPilot homepage for this level.
|
The proposed visuals will only be the visuals related to the properties available on the level. |