Introduction
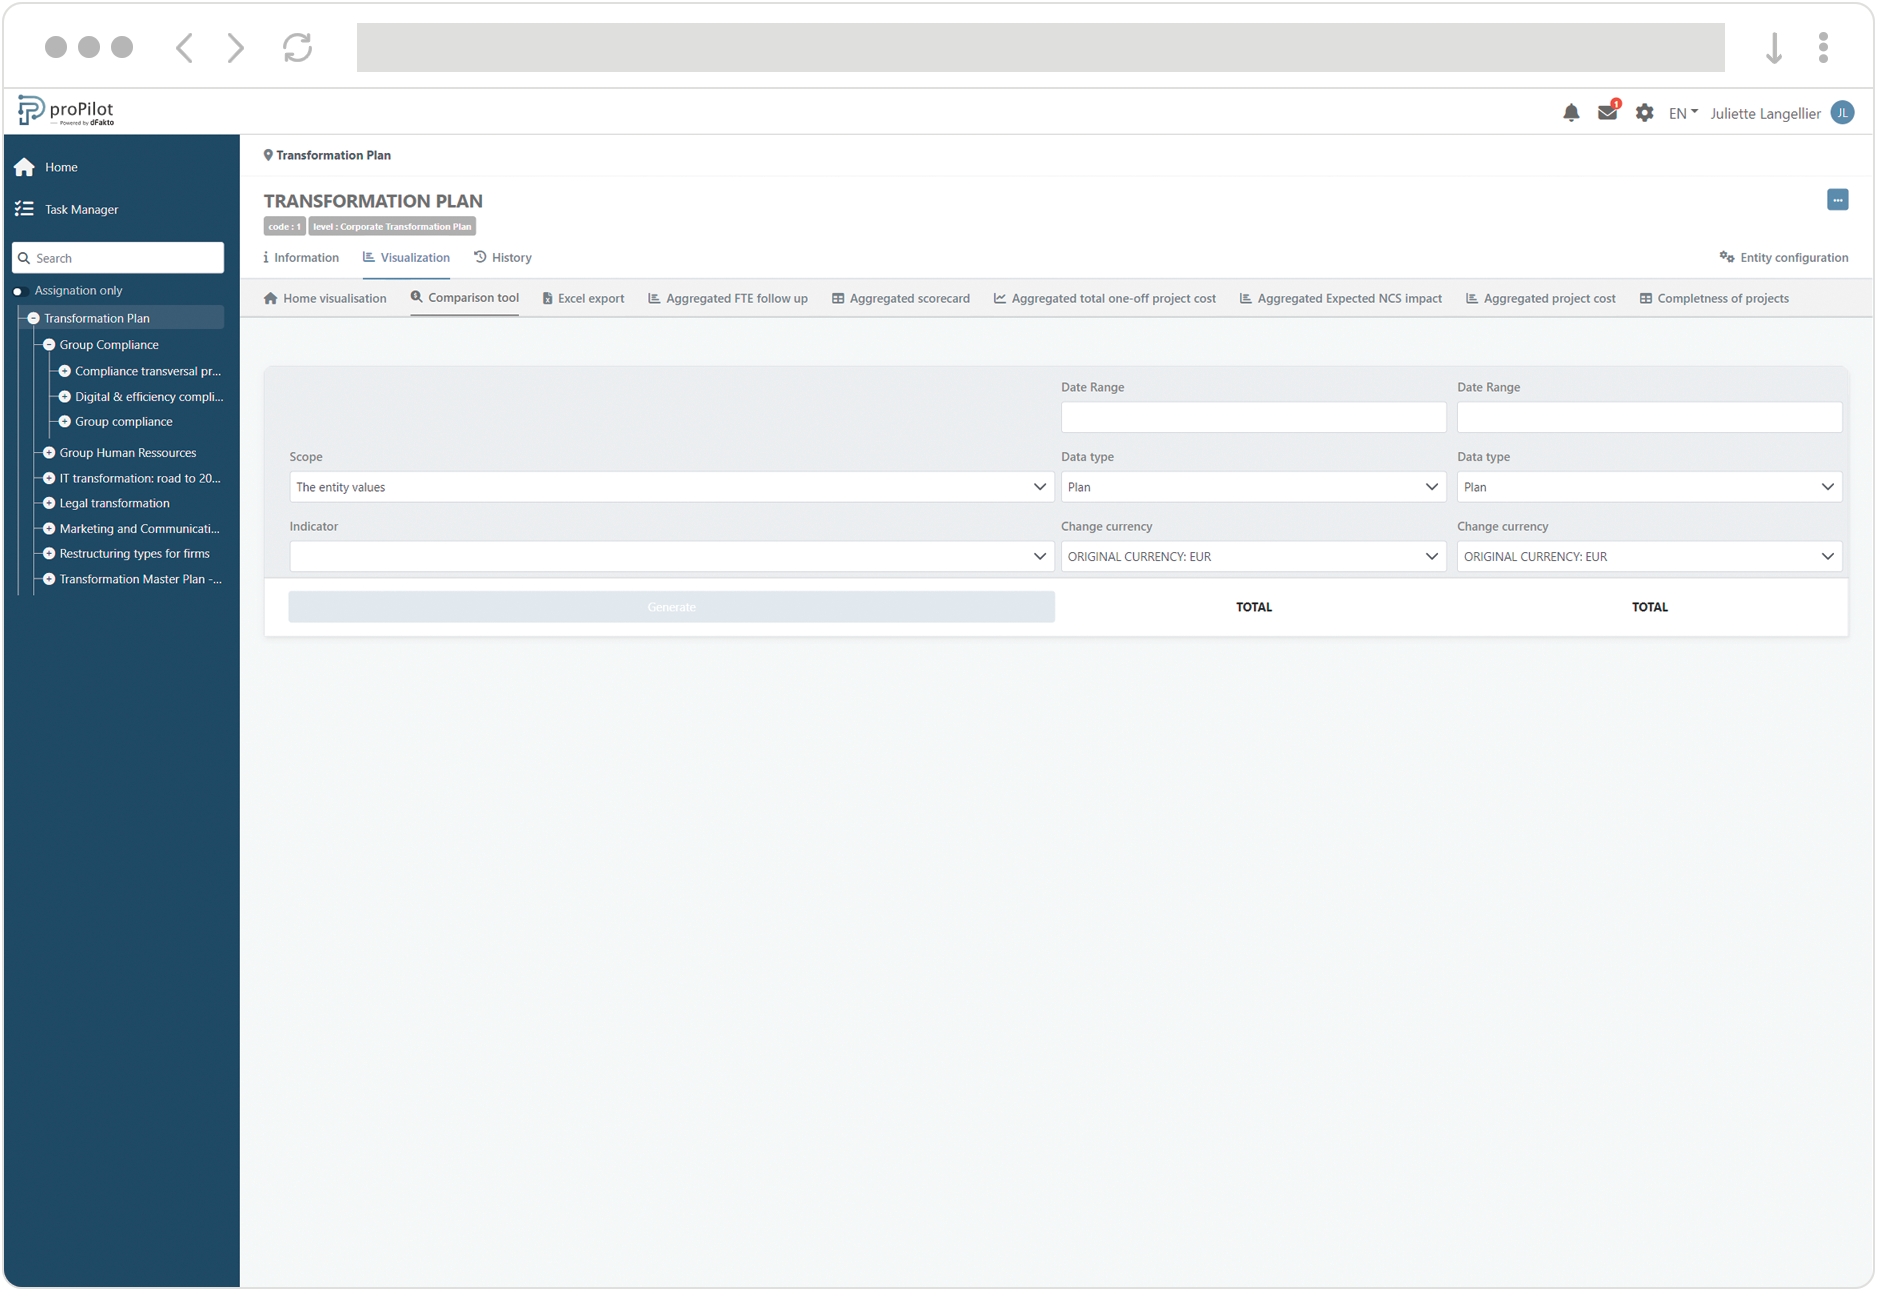
This module allows you to compare indicators with each other through a series of parameters: date range, data type, currencies...
Create a comparison tool
-
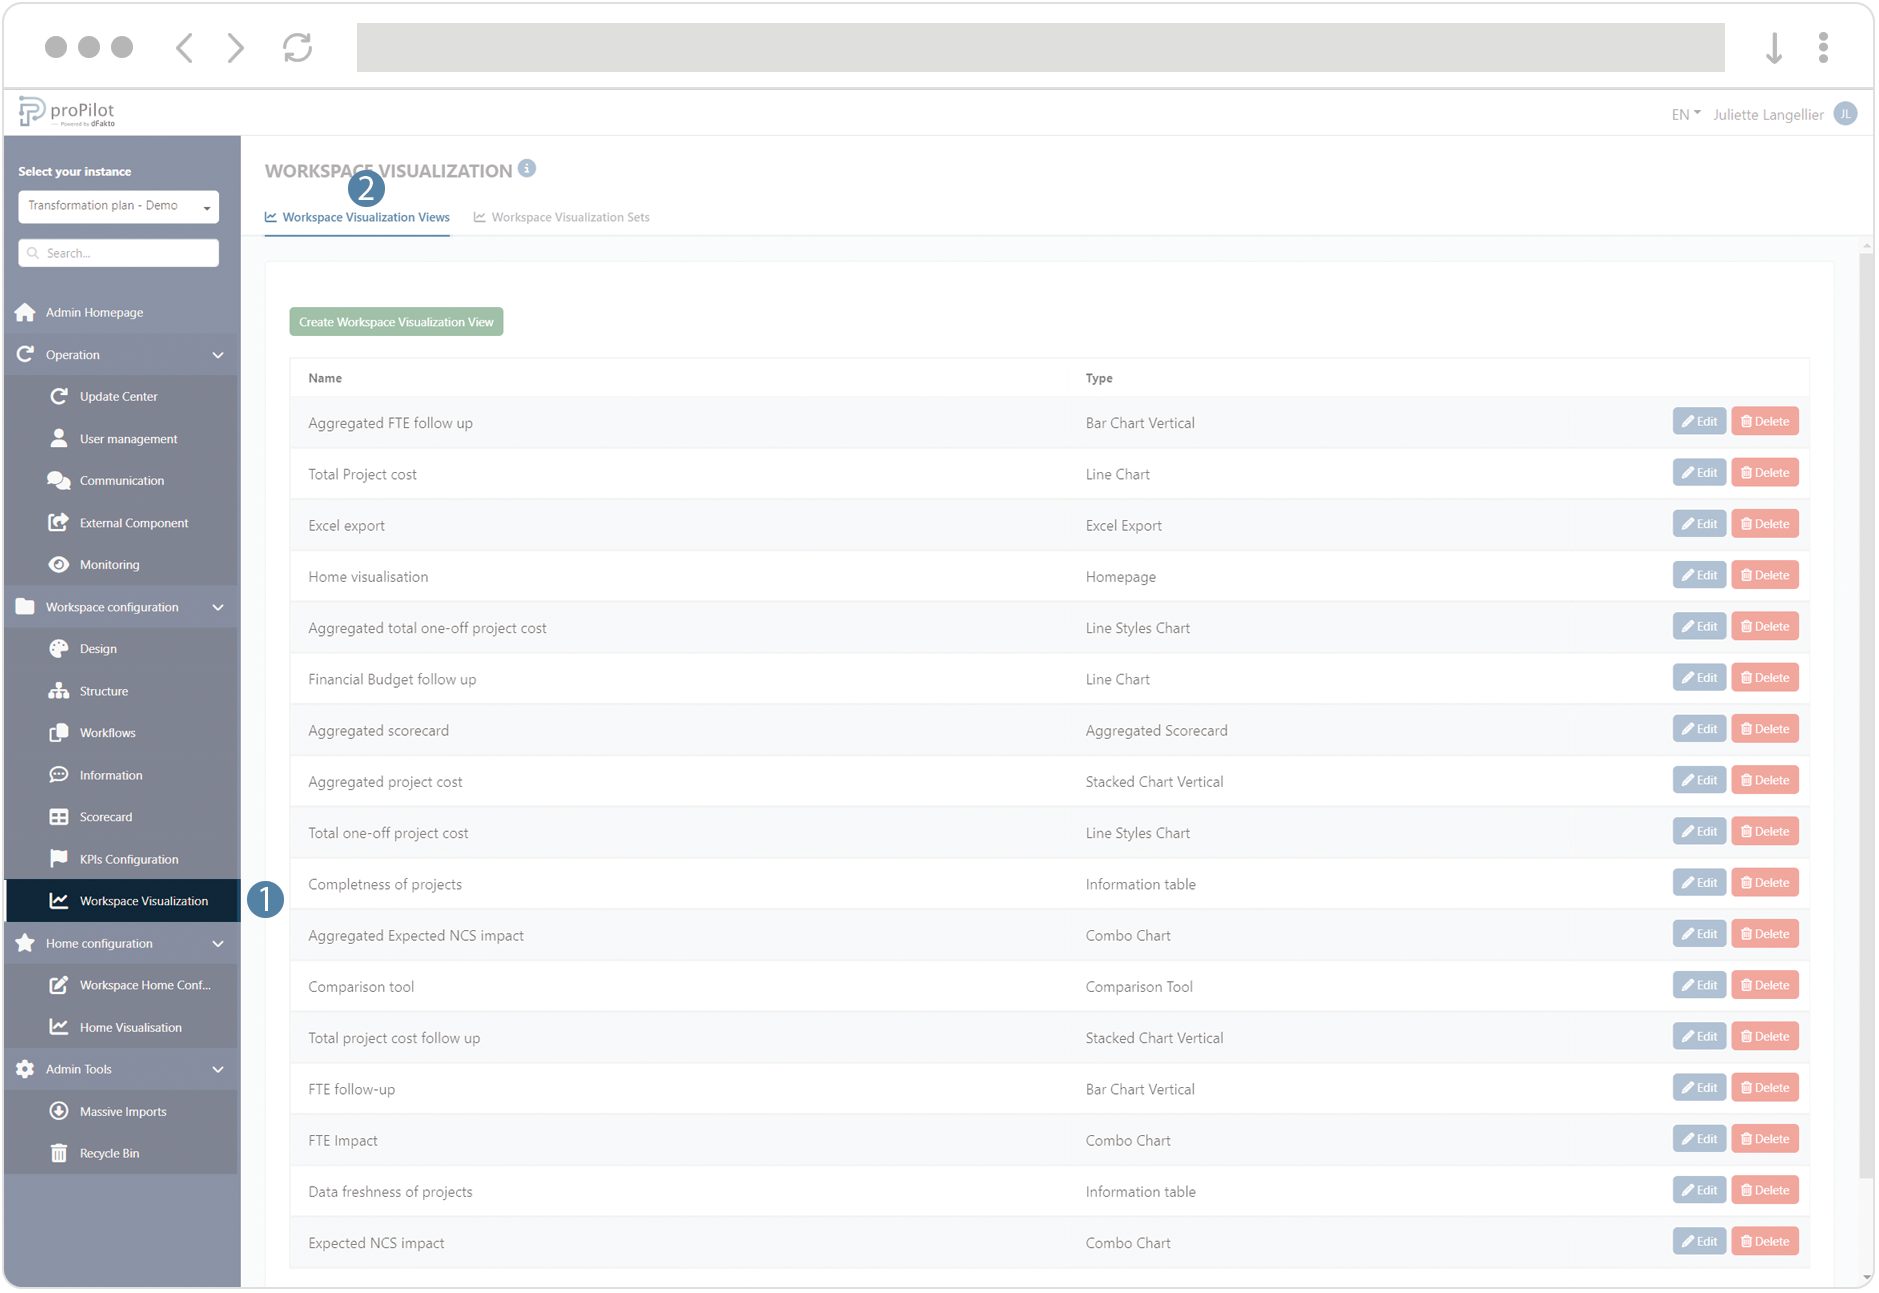
In the left menu, select "workspace configuration" and then "workspace visualization".
-
Then click on the "workspace visualization views" tab.
-
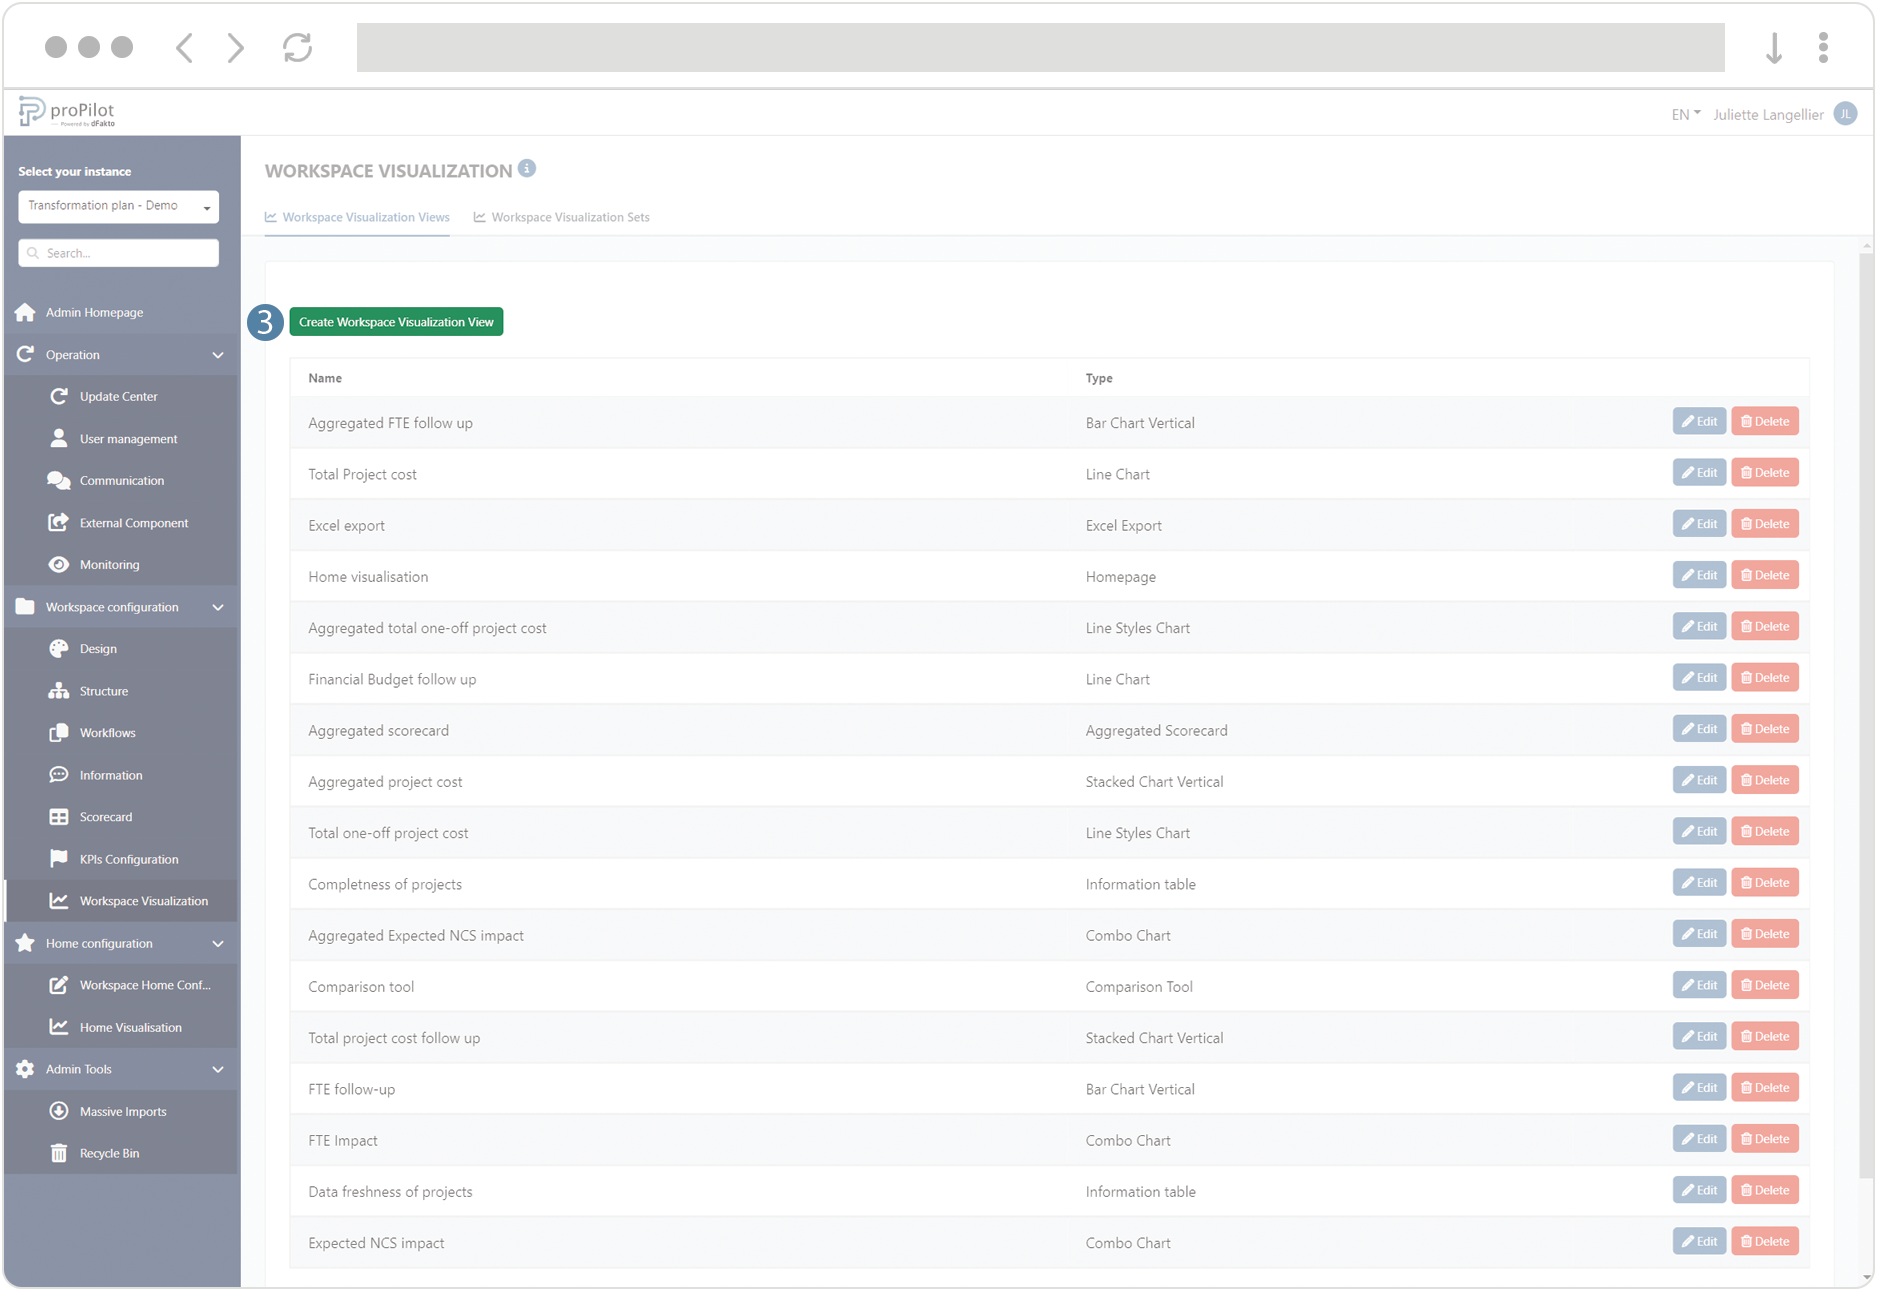
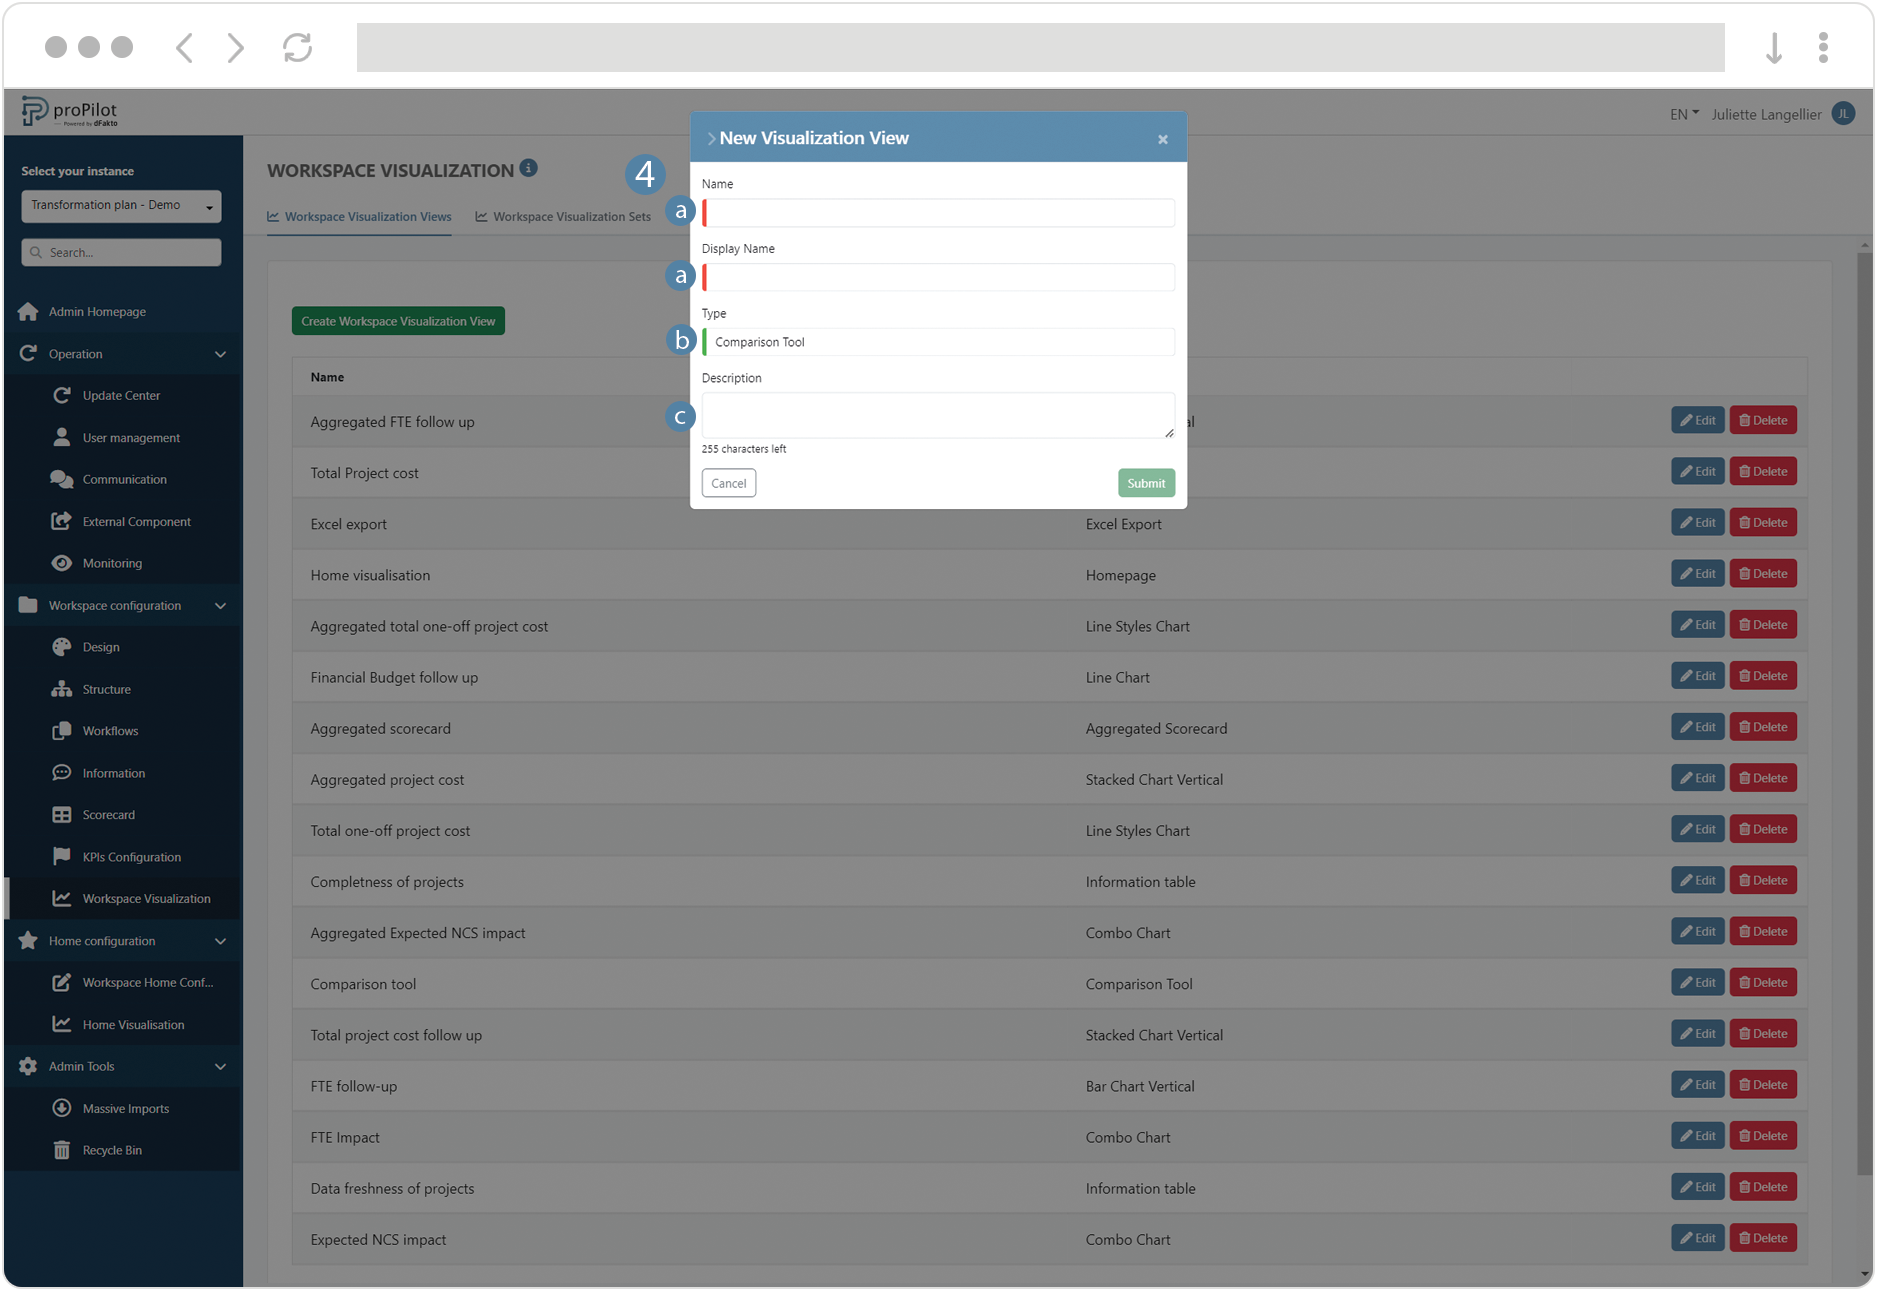
Click on the "create workspace visualization view" button. A pop-up window will open.
-
Select: "Comparison tool" and fill in the following fields:
-
(technical name) and display name
-
Choose the visualization type "ComparisonTool"
-
Add a description if necessary
-
-
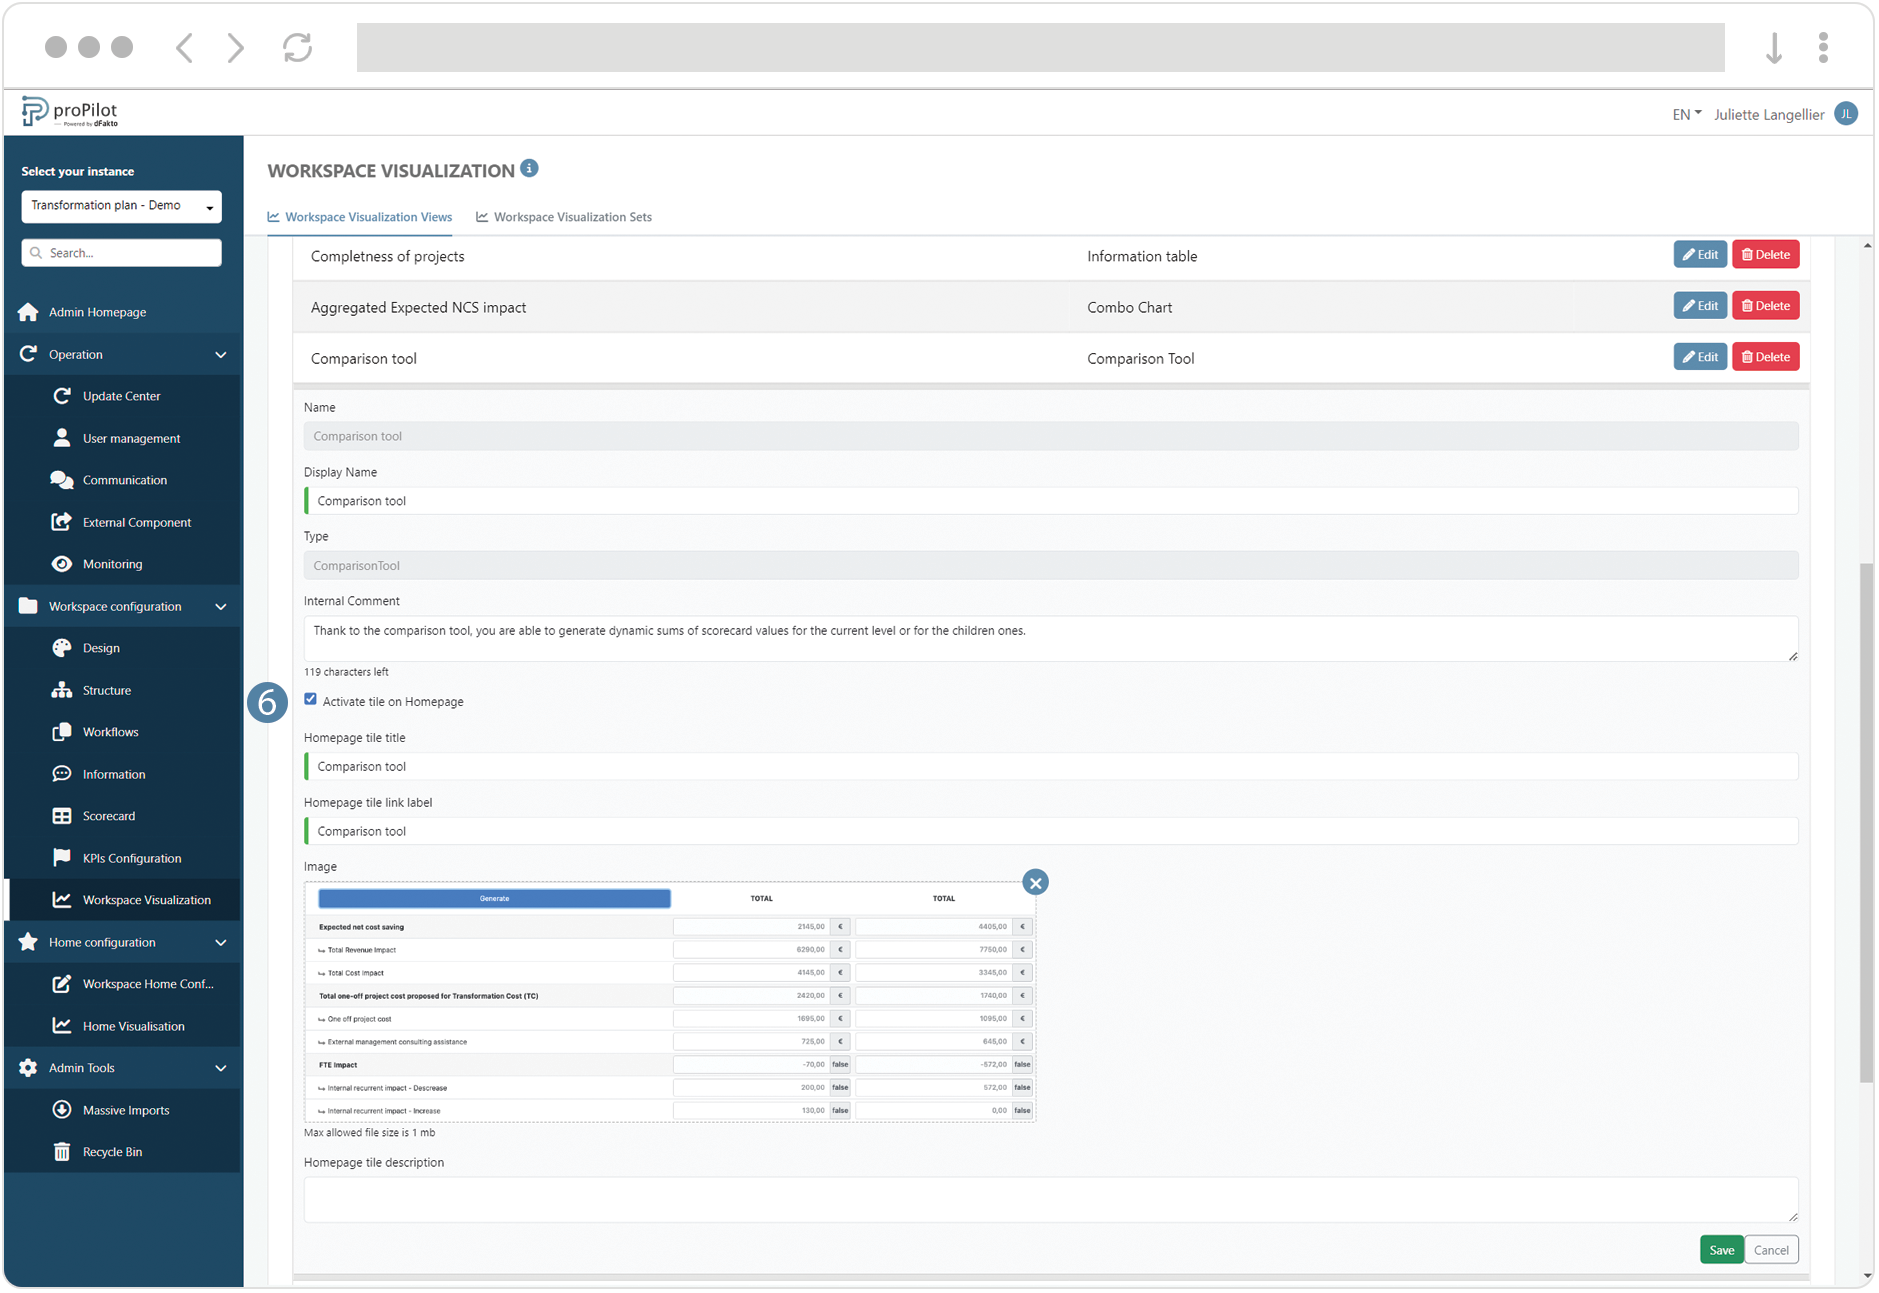
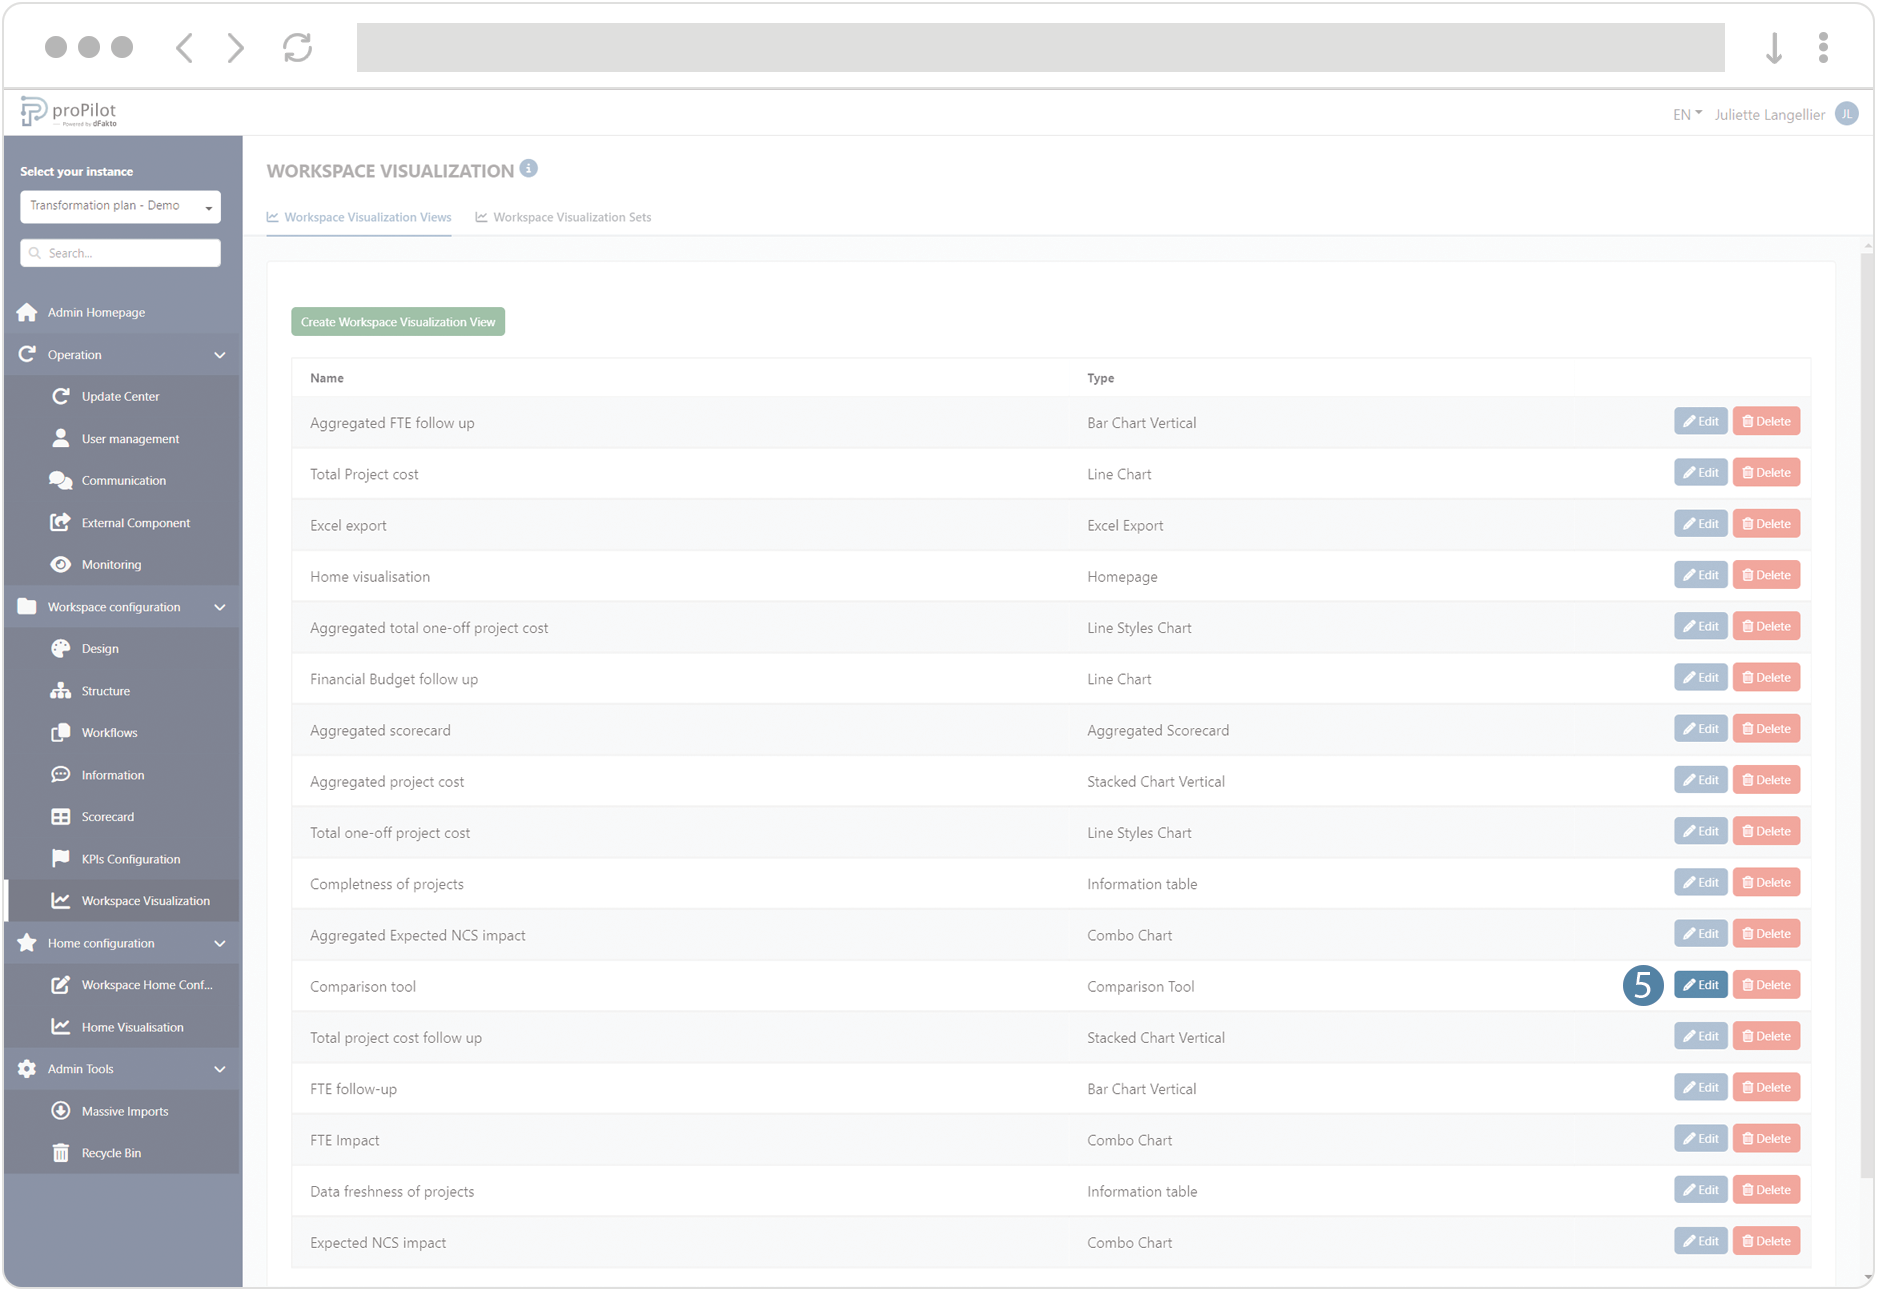
Save the visualization view, then click on the “Edit” button.
-
Configure the Comparison tool : enable the tile in the entity visualization homepage.