
Introduction
Analyze and visualize your data thanks to reports produced by proPilot directly or through one of your external reporting tools.
Exploit your data efficiently throught the “vizualisation” tab available in each of your entities.
Access to multiple viz and tool through the visualization module
How can you access the vizualisation module?
Navigate to the desired entity, and click on the tab “vizualisation”.
What does the module include?
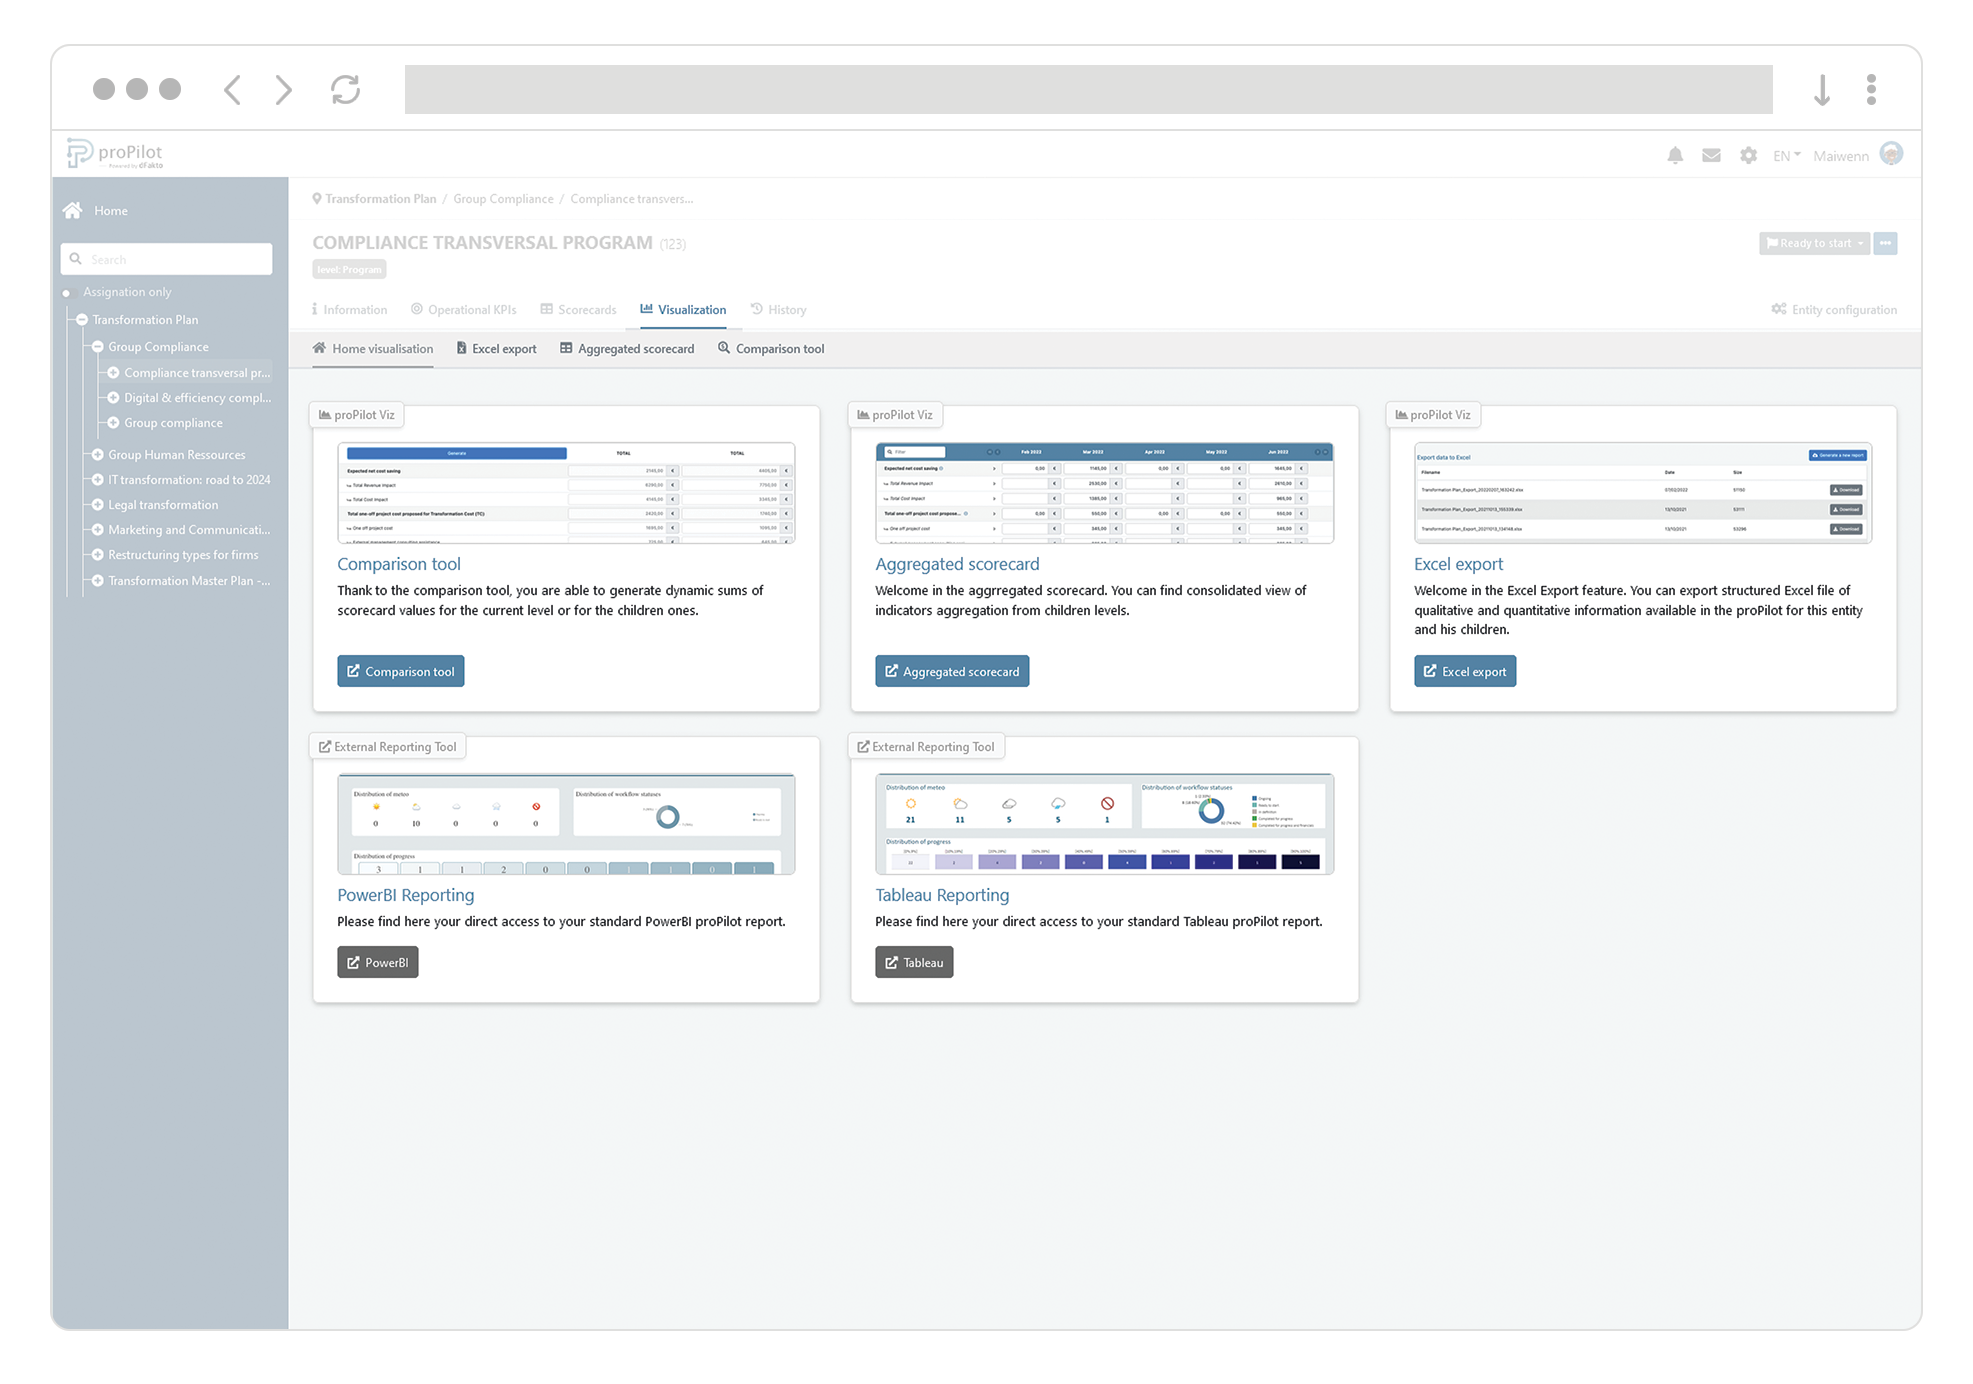
The vizualisation module includes one or more views such as:
-
A Comparison tool, which enables the possibility to compare indicators between each other.
-
An Aggregated scorecard which compiles the data of the underlying entities as a sum for each concerned indicator.
-
An Excel Export of the entity’s data and the data of all its underlying entities.
-
A link to preconfigured reporting tools such as Toucan Toco, Tableau, Power BI, Qlik, etc.