Scorecard module: collect your quantitative information in real time
Introduction
Discover how to update your plan in proPilot.
In each entity, you can collect and visualize quantitative information thanks to a “scorecard”.
Through the different indicators you are then able to update the quantitative information which really matters.
The values are input at specific, predefined dates (daily, monthly, annually,etc.)
Following up and updating scorecard
Access to your scorecard
Navigate to your entity and select the tab “scorecard”.
Update your indicators' values
Select the period and the data type you wish to update.
Update your indicators' values and confirm by clicking on the “save” button.
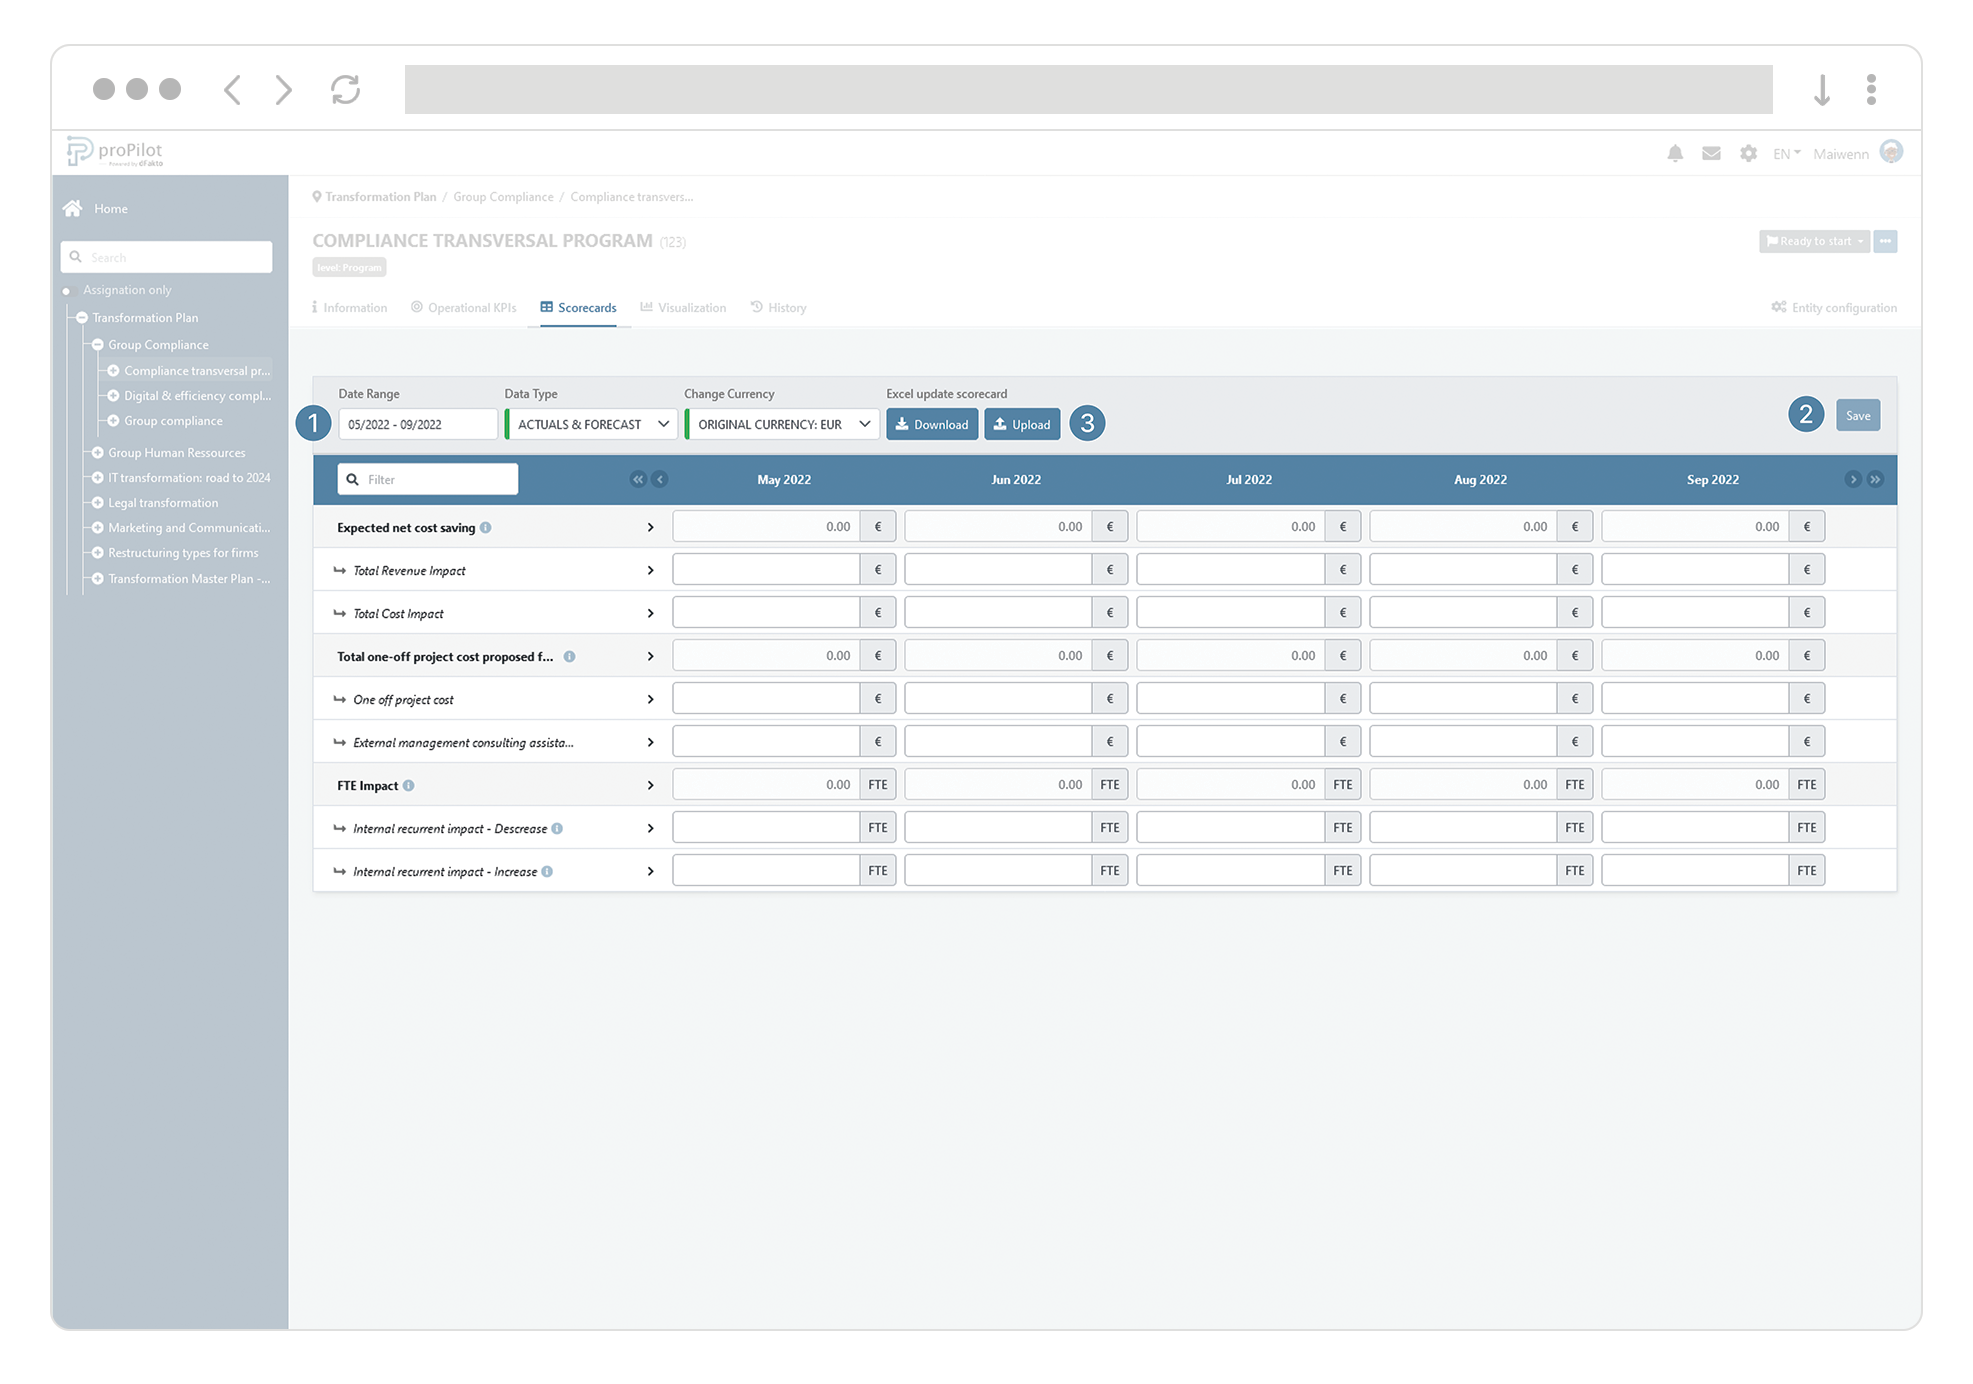
When a value is updated, the “last update date” of your scorecard is adjusted accordingly.
The “last update date” is available in the upperright corner of the scorecard.
Display an indicator’s details and its associated values
To ensure an optimal quality of the data collection, you have access to a set of preconfigured information regarding your indicator.
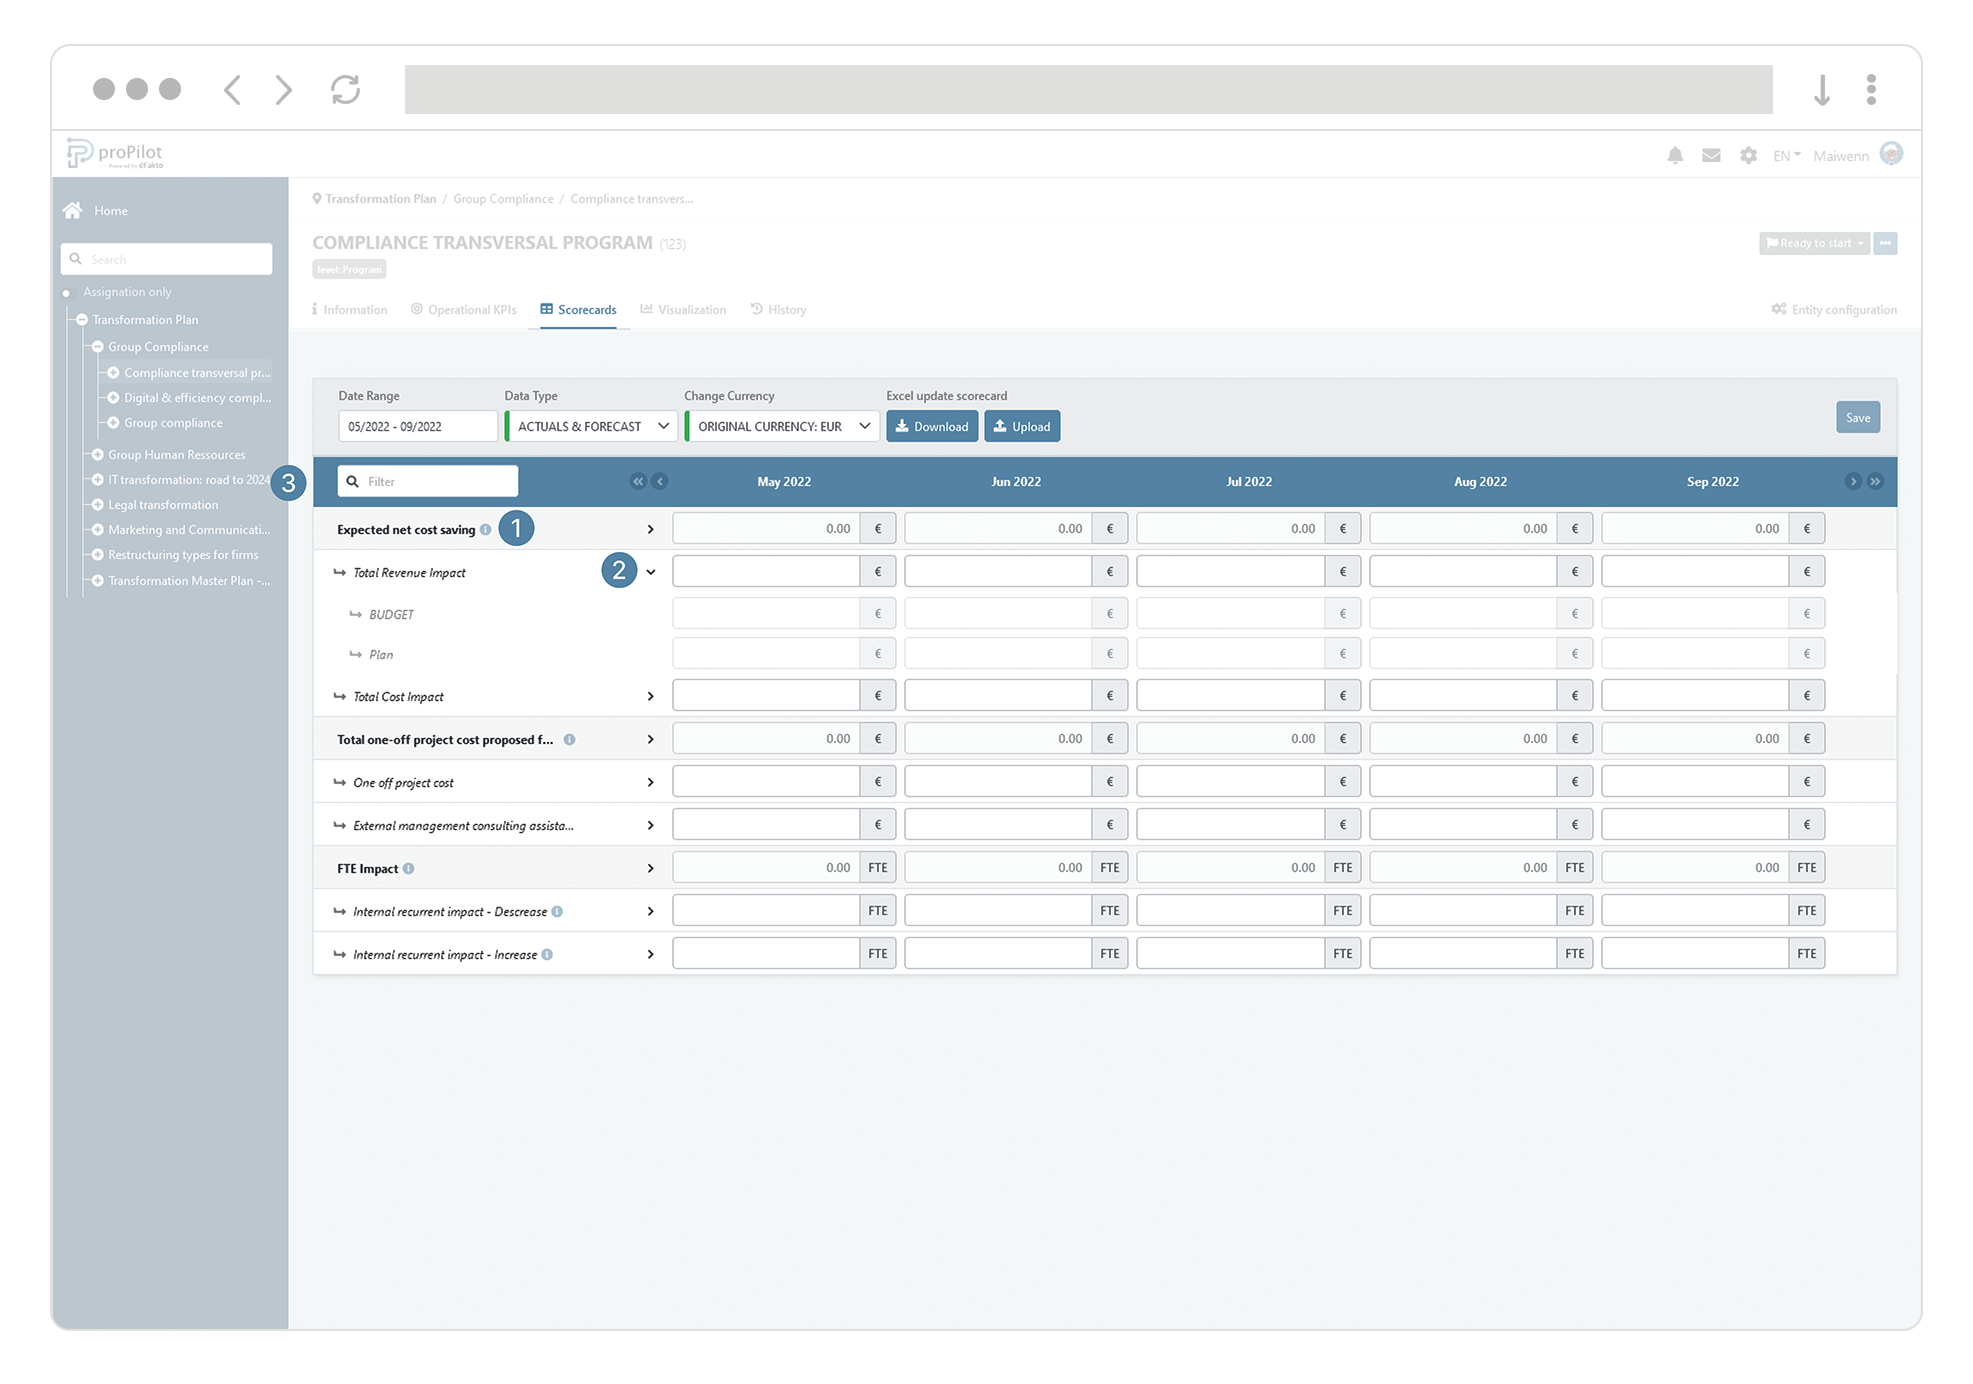
To display an indicator’s description and full fact sheet (including data governance information), click on the “
 ” next to the indicator.
You may compare the datatypes directly in the table by clicking on the arrow next to the indicator’s name.
A search bar is available to help you find a particular indicator.
For each indicator, a unit may be present.
Some indicators may have specific value limitations to avoid entry errors.
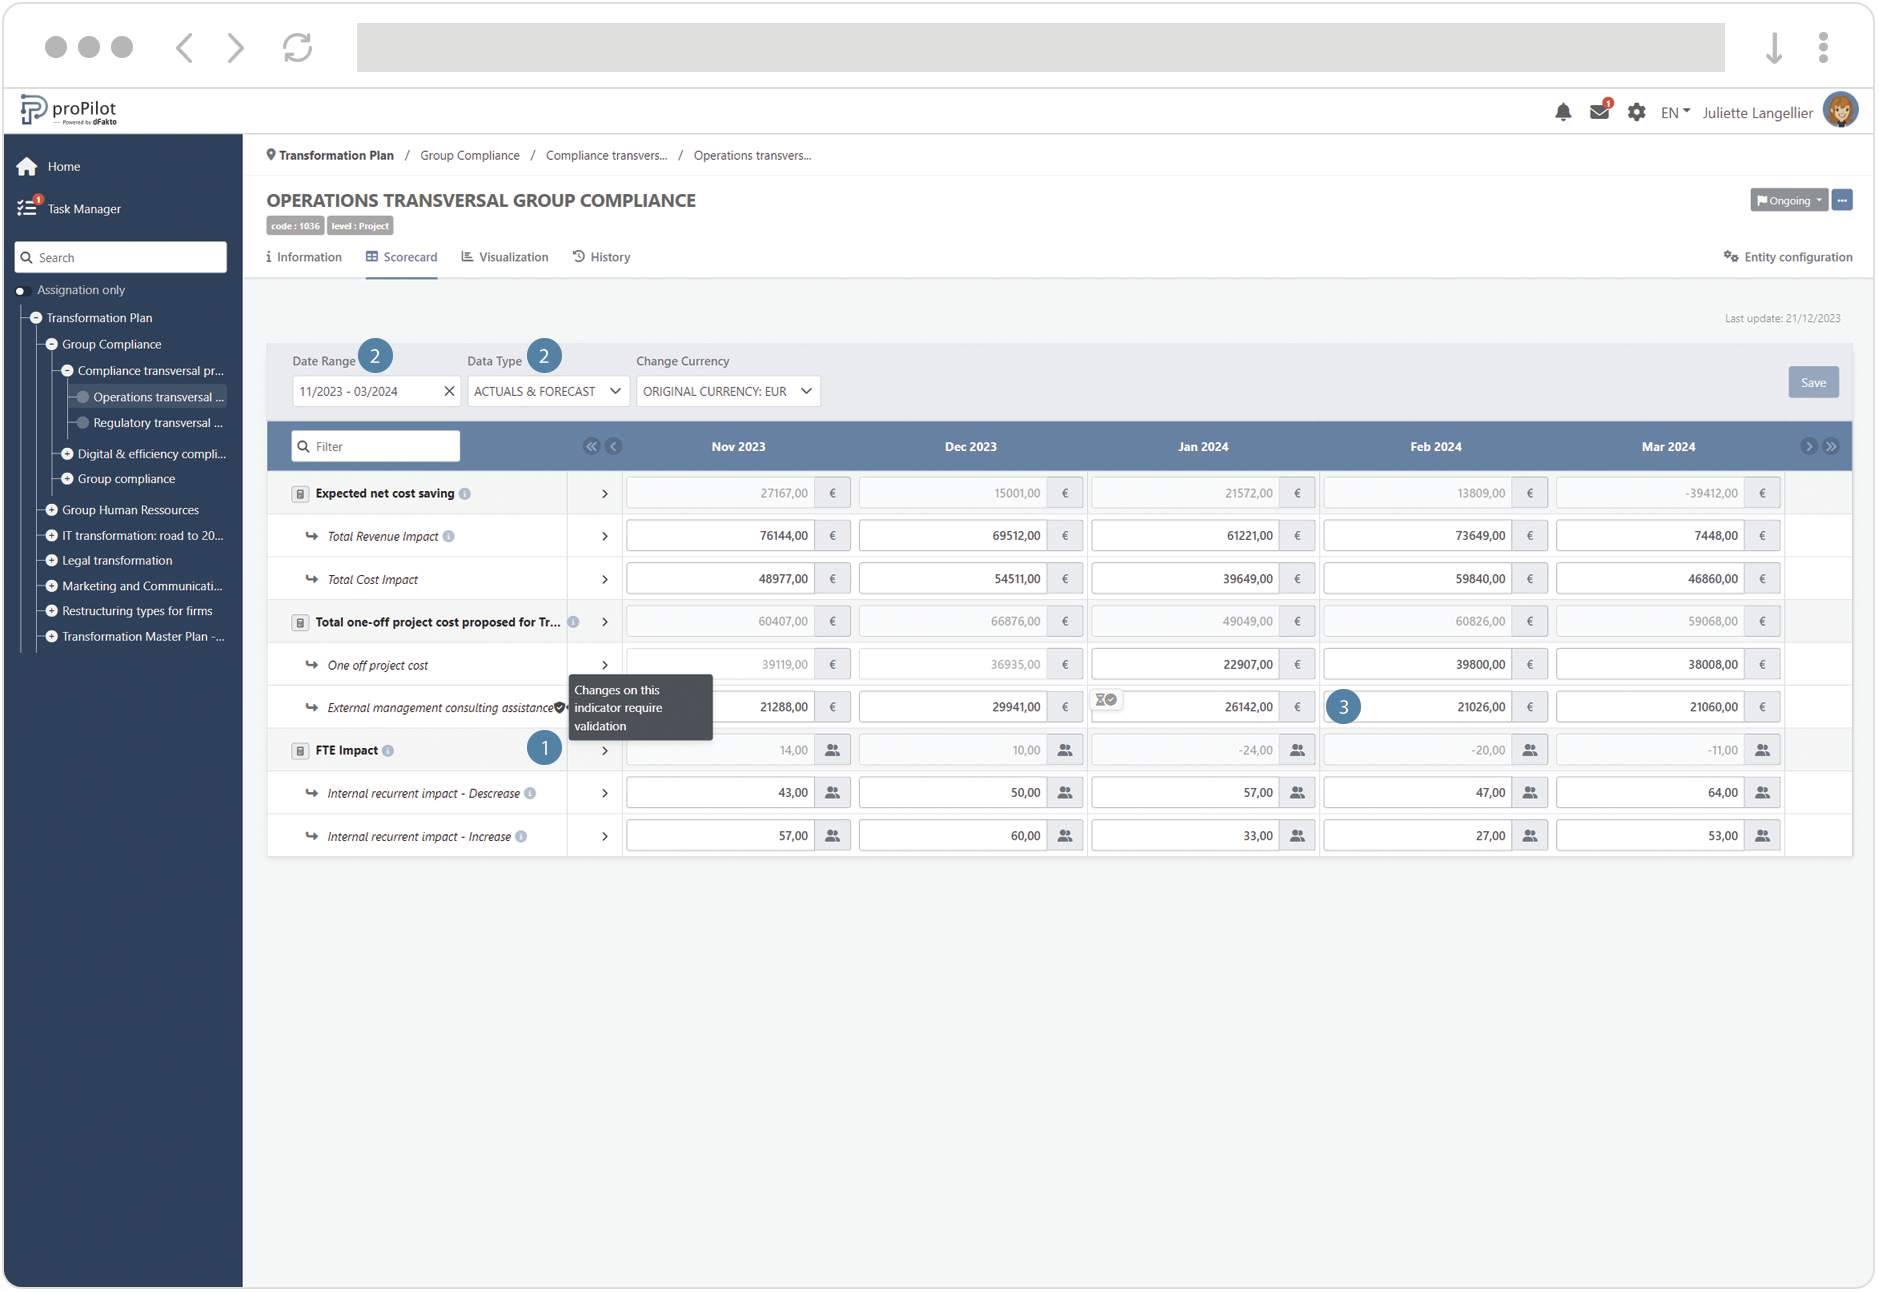
Request a value update for indicators requiring validation
Indicators for which validation is required are indicated by a specific icon 🛡️
Select the time period and type of data that you want to update.
Select the value that you want to update
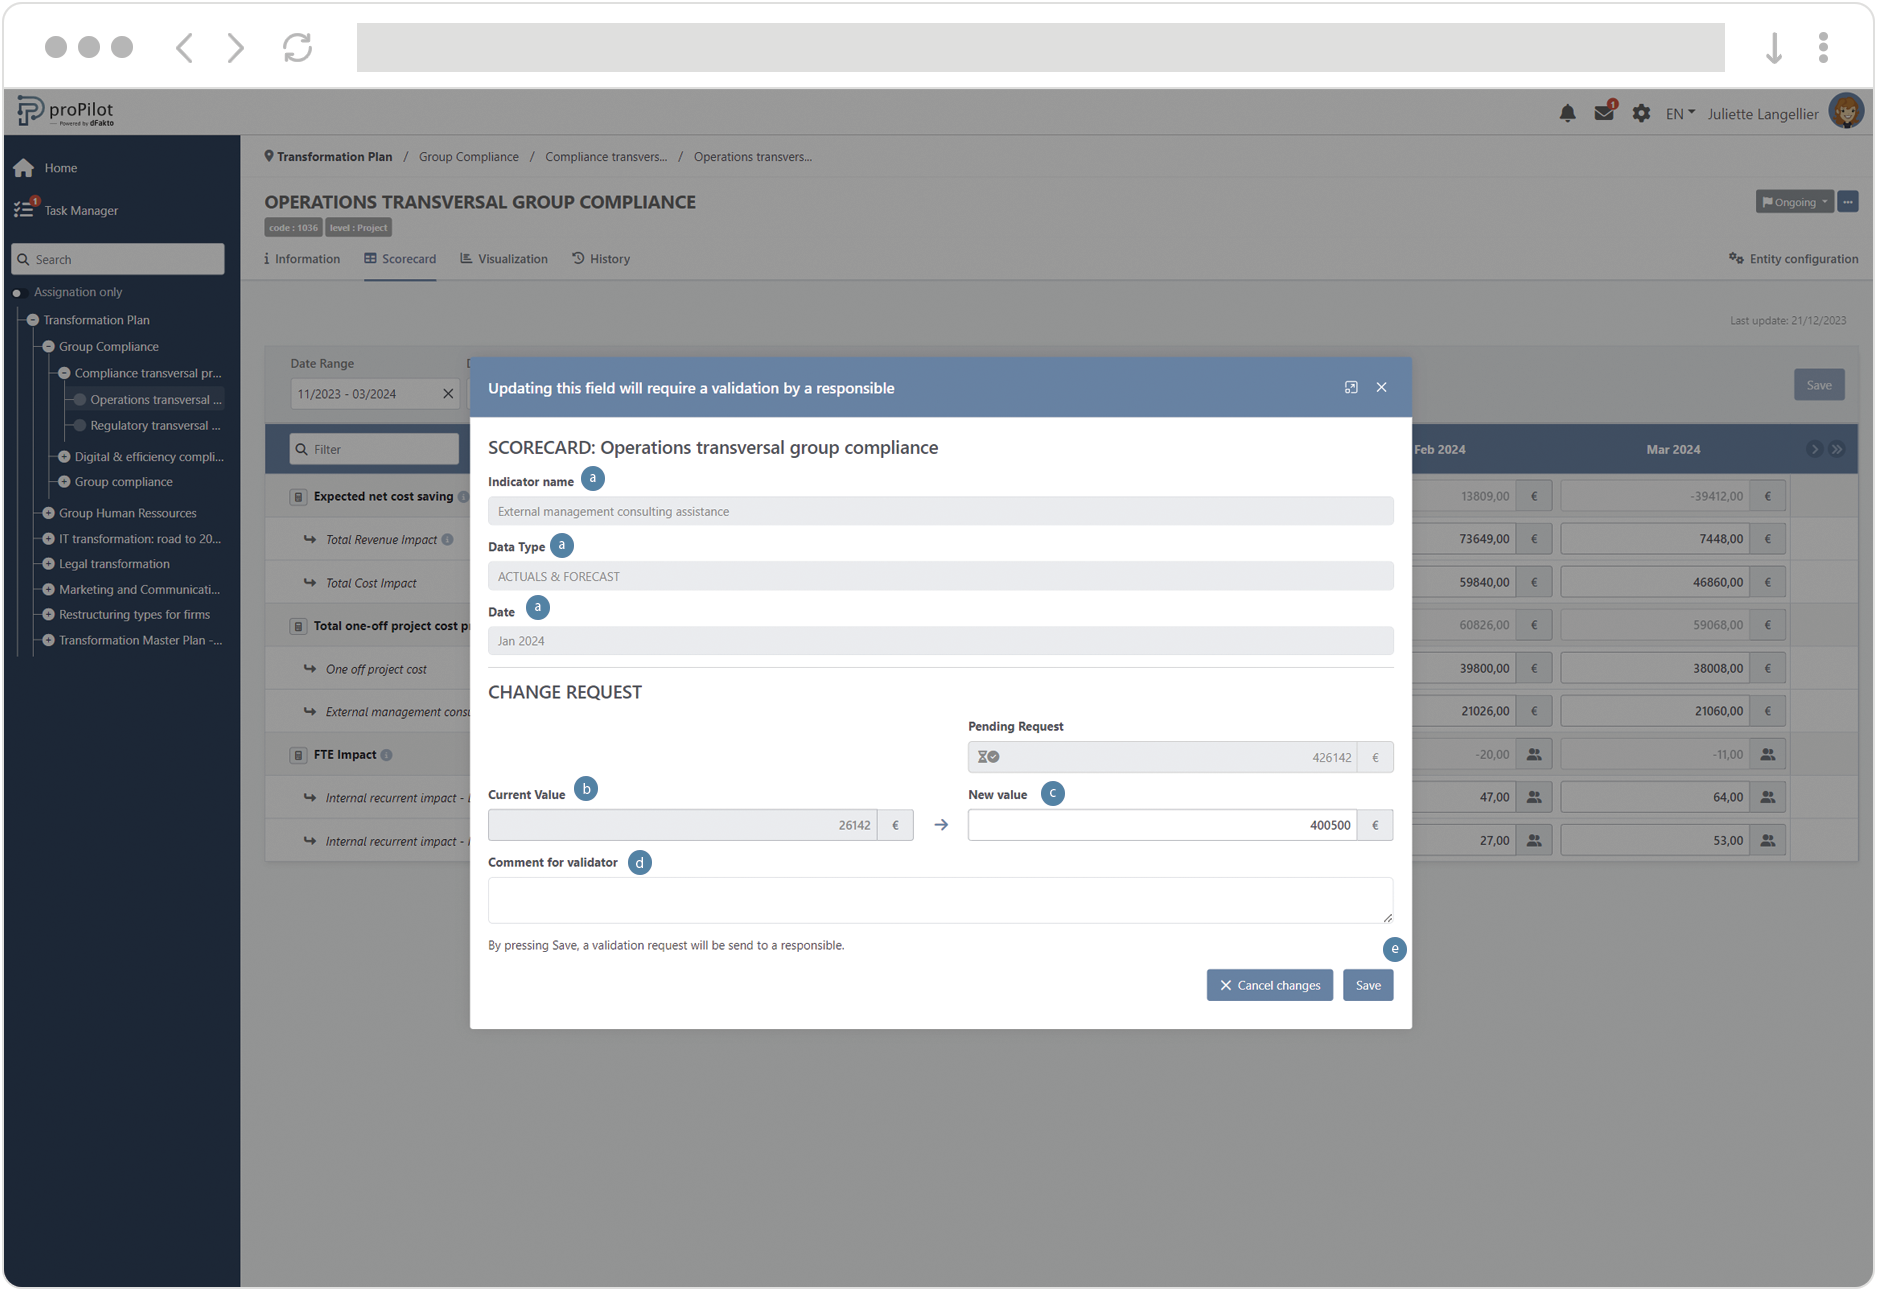
A pop-up window appears.
The indicator name, data type and date selected appear for information.
You have a view of the current value of the indicator
You can request a new value for the indicator
You can encode a comment for the validator.
Submit the new value by pressing “save”
View pending requests on indicator values
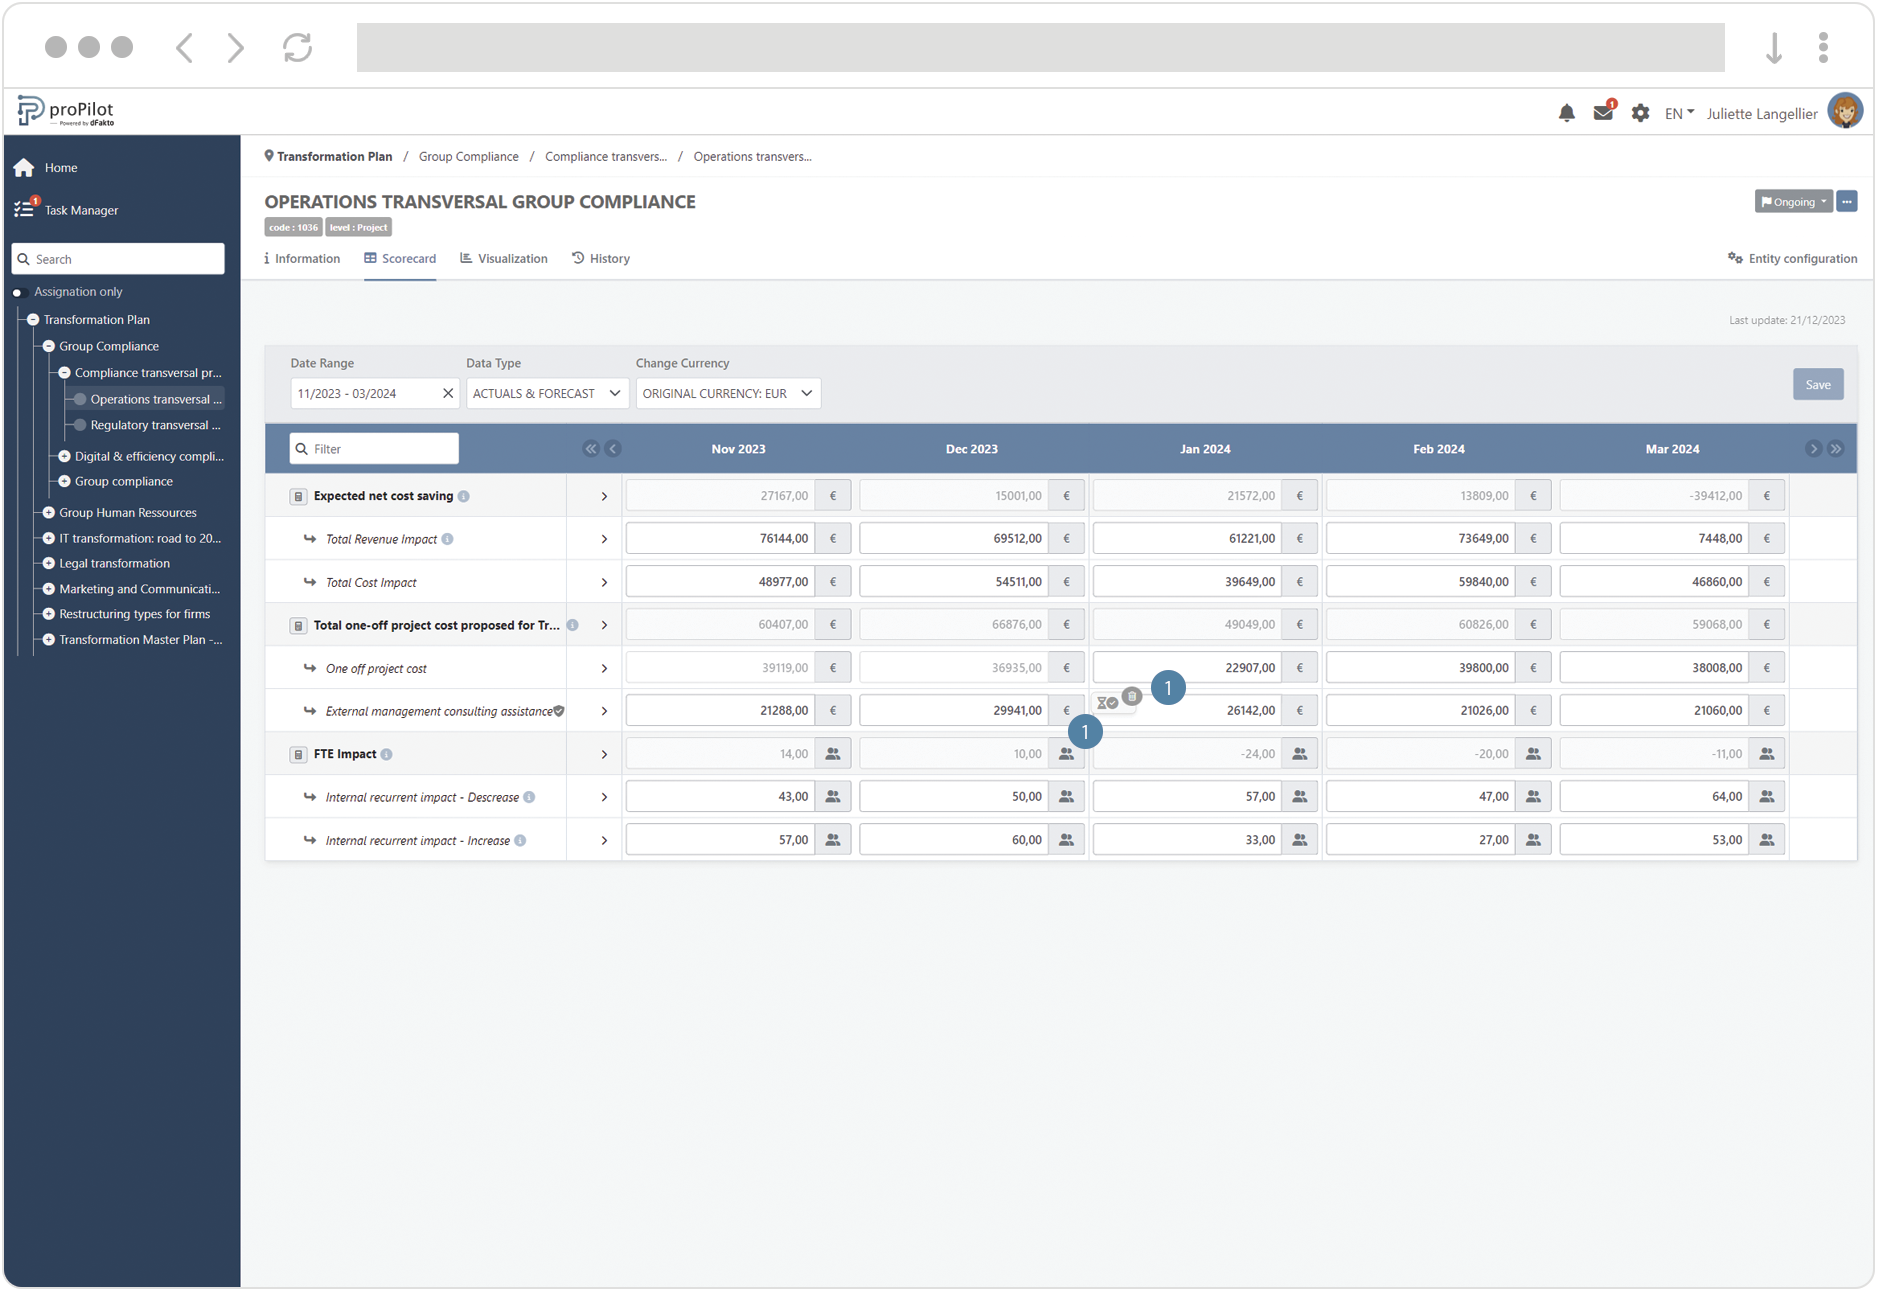
For each indicator and data type requiring validation, the dates for which a value is awaiting validation are indicated by the icon ⏳. You can submit a new value: this will then replace the pending value.
If you yourself submitted a new value and it is awaiting validation, you can cancel your change request by clicking on the icon 🗑️ .
View the contextual history of your indicators
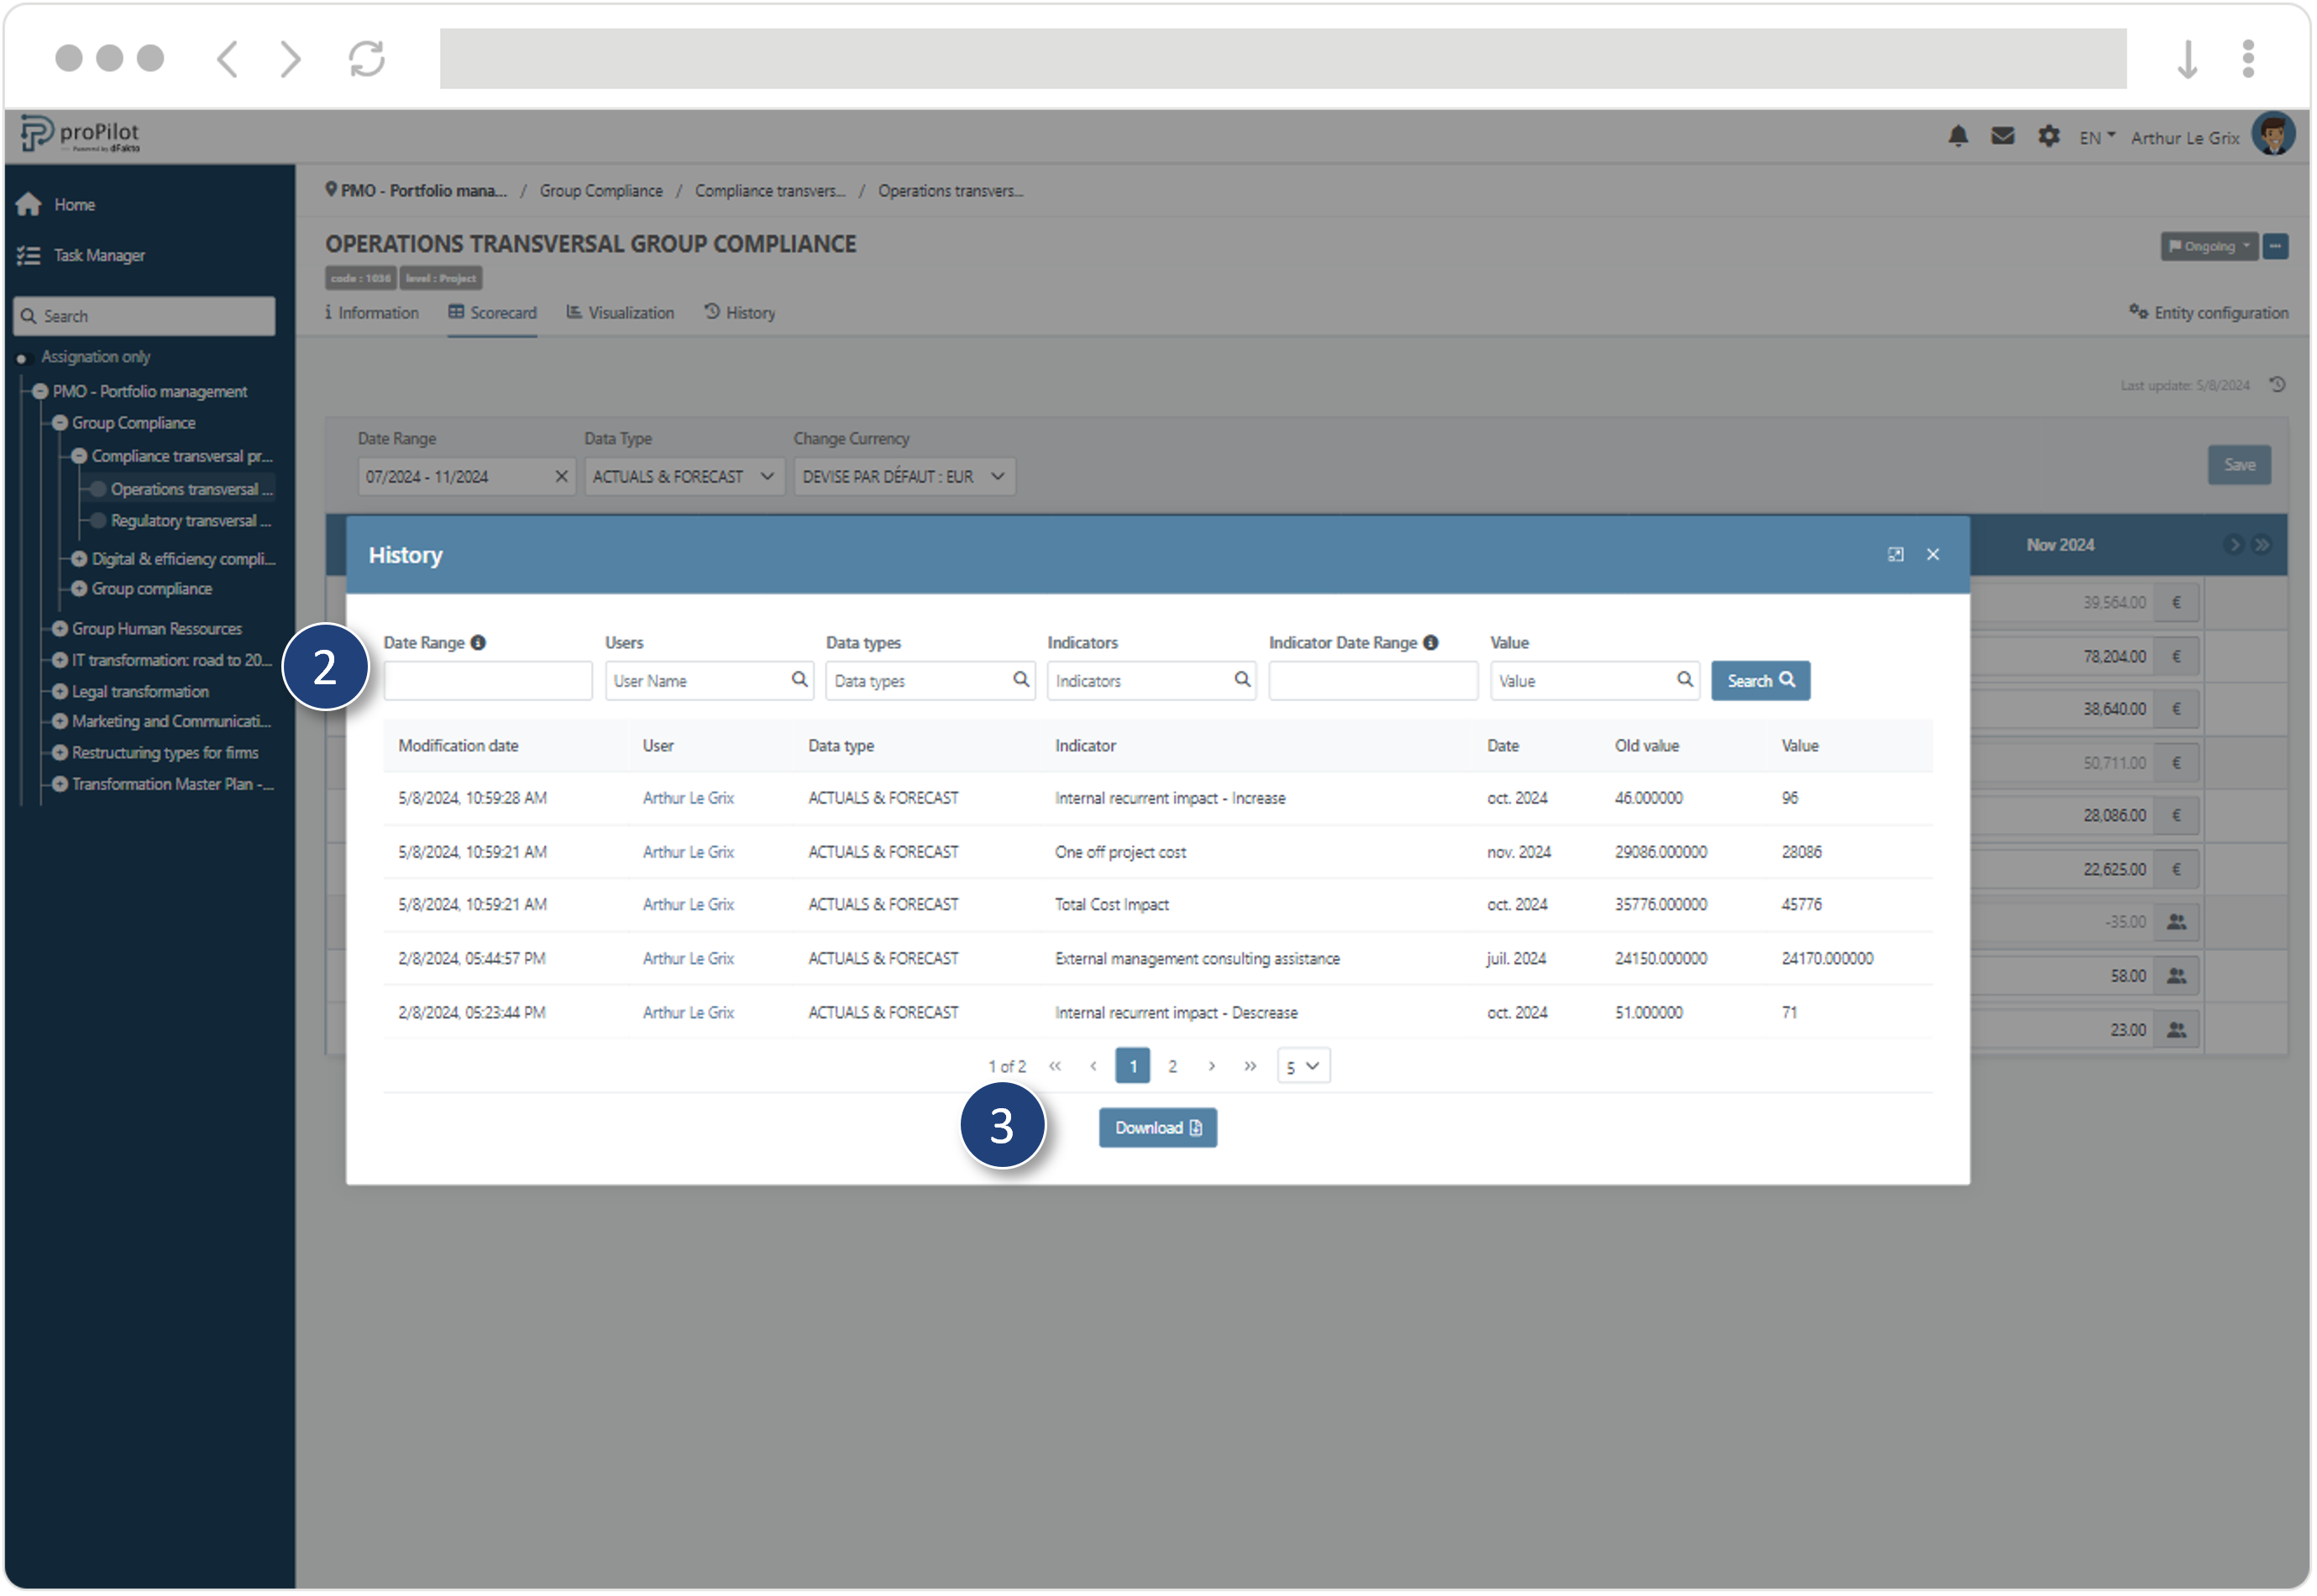
For all the indicators in the scorecard, you benefit from a dedicated interface where you can view the history of values and the people responsible for changes.
At the top right of the table, click on the dedicated icon (
 ). You'll then see the contextual history in a modal window.
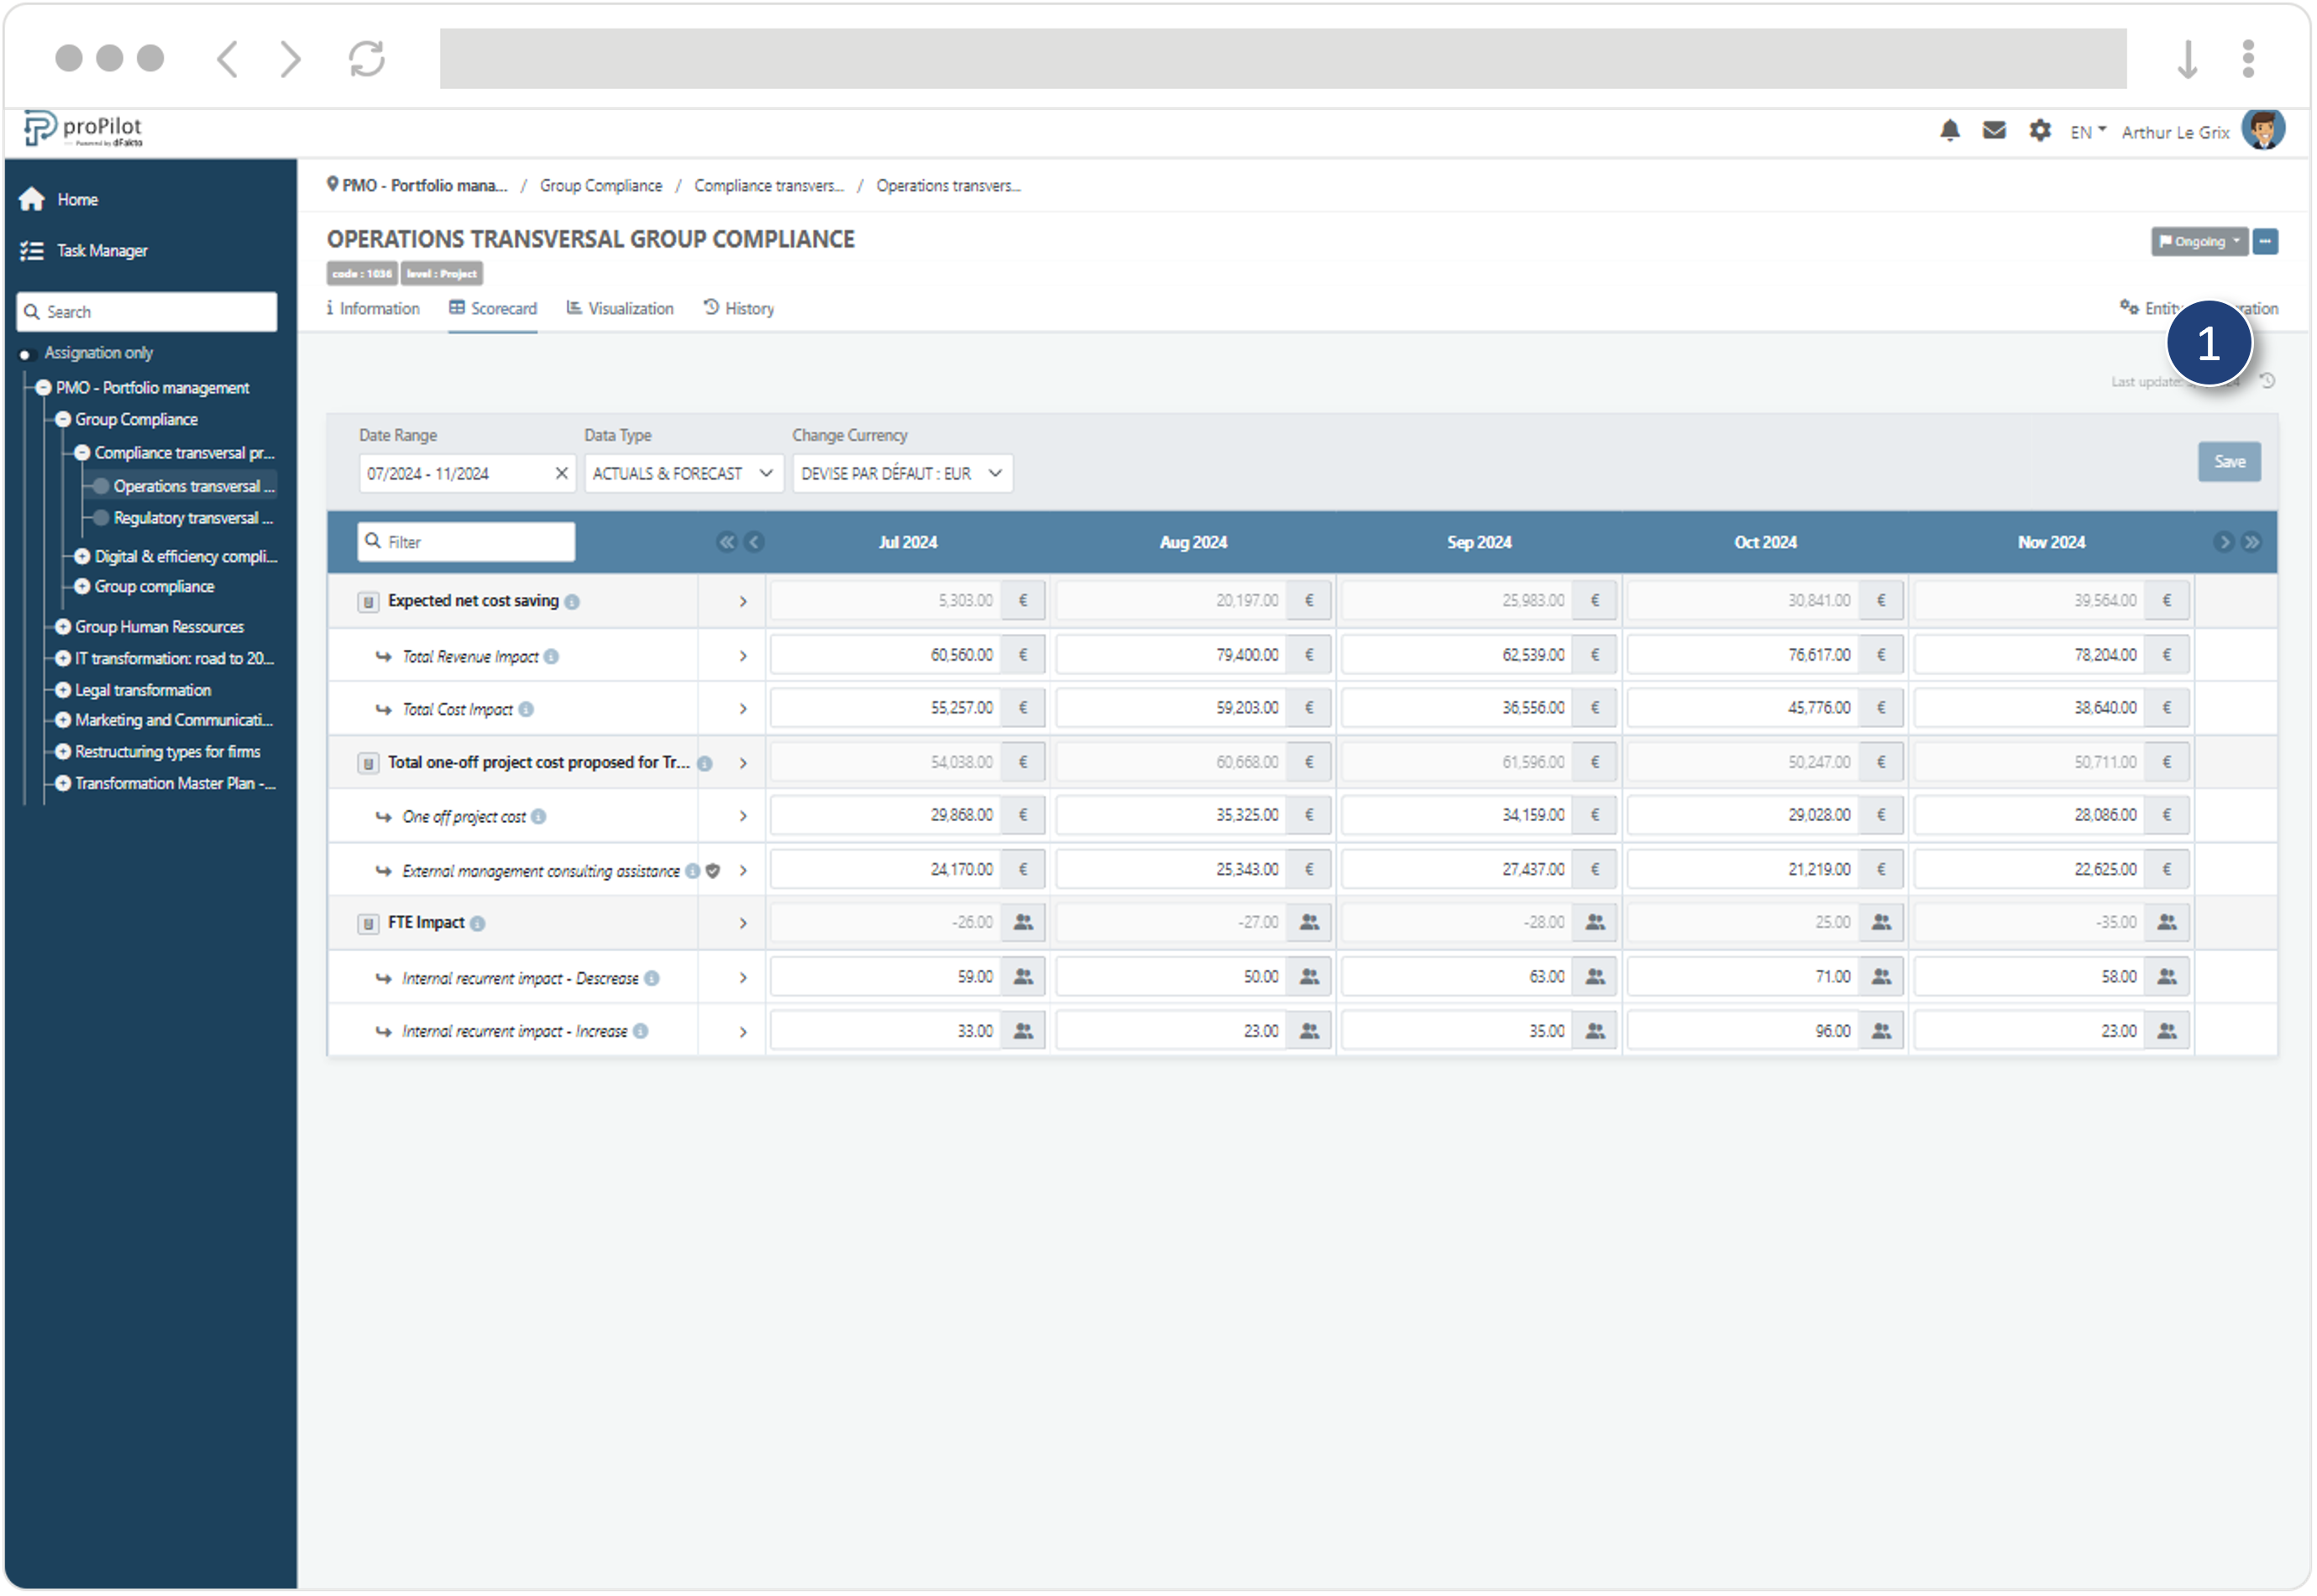
The history can be easily filtered by date, user and value. Indicators can be filtered by name and data type (budget, actual...).
All data can be exported in a structured format.
