proPilot 4.16.0
proPilot 4.16.0 is here, welcome to an even more powerful experience!
Let's explore together the new features that will allow you to reconnect strategy with achievements!
Charts now show the evolution of your indicators in cumulative values!
In ProPilot integrated charts, you can now display indicators in a cumulative view, even if they were initially collected non-cumulatively. The display dynamically adjusts based on the type of collection (cumulative or not) and the type of aggregation linked to the indicator. This feature allows you to visualize the progression of your indicators against your goals. The overall visualization performance has also been improved, ensuring a clearer view of progress directly within ProPilot.
For all types of available charts, you can choose to display cumulative values for a defined indicator and data type.
Cumulative displays are generated according to the data governance information linked to the indicator, as configured in the administration interface (e.g., total cumulative, year-to-date cumulative starting from a specific month).
The display of data originally collected in cumulative form has also been enhanced.
.png?inst-v=92d2934e-11c1-4787-8542-345f0ca46eea)
Add your custom profile photo for better visibility of roles and responsibilities.
Users can now upload a custom profile photo via their personal space. Strengthen your sense of belonging and improve the visibility of user roles and responsibilities within ProPilot.
In the "Profile" section of your personal space, updating your profile photo is a one-click process with an image uploaded from your computer.
Users are identified by their profile photo throughout the application.
Generic profile pictures remain available as an option.
.png?inst-v=92d2934e-11c1-4787-8542-345f0ca46eea)
.png?inst-v=92d2934e-11c1-4787-8542-345f0ca46eea)
Easier validation of changes to the indicator table with always-accessible floating buttons.
Simplify updates to the Indicator Table with new floating "Save" and "Cancel" buttons. Always accessible, these buttons allow you to instantly save changes or revert to the previous state without scrolling back to the top of the table.
.png?inst-v=92d2934e-11c1-4787-8542-345f0ca46eea)
New full-screen mode for tables for better accessibility.
Efficiently review information with the new "Full Screen" feature for data tables. This option allows you to display more rows, optimizing readability and facilitating data analysis linked to entities.
.png?inst-v=92d2934e-11c1-4787-8542-345f0ca46eea)
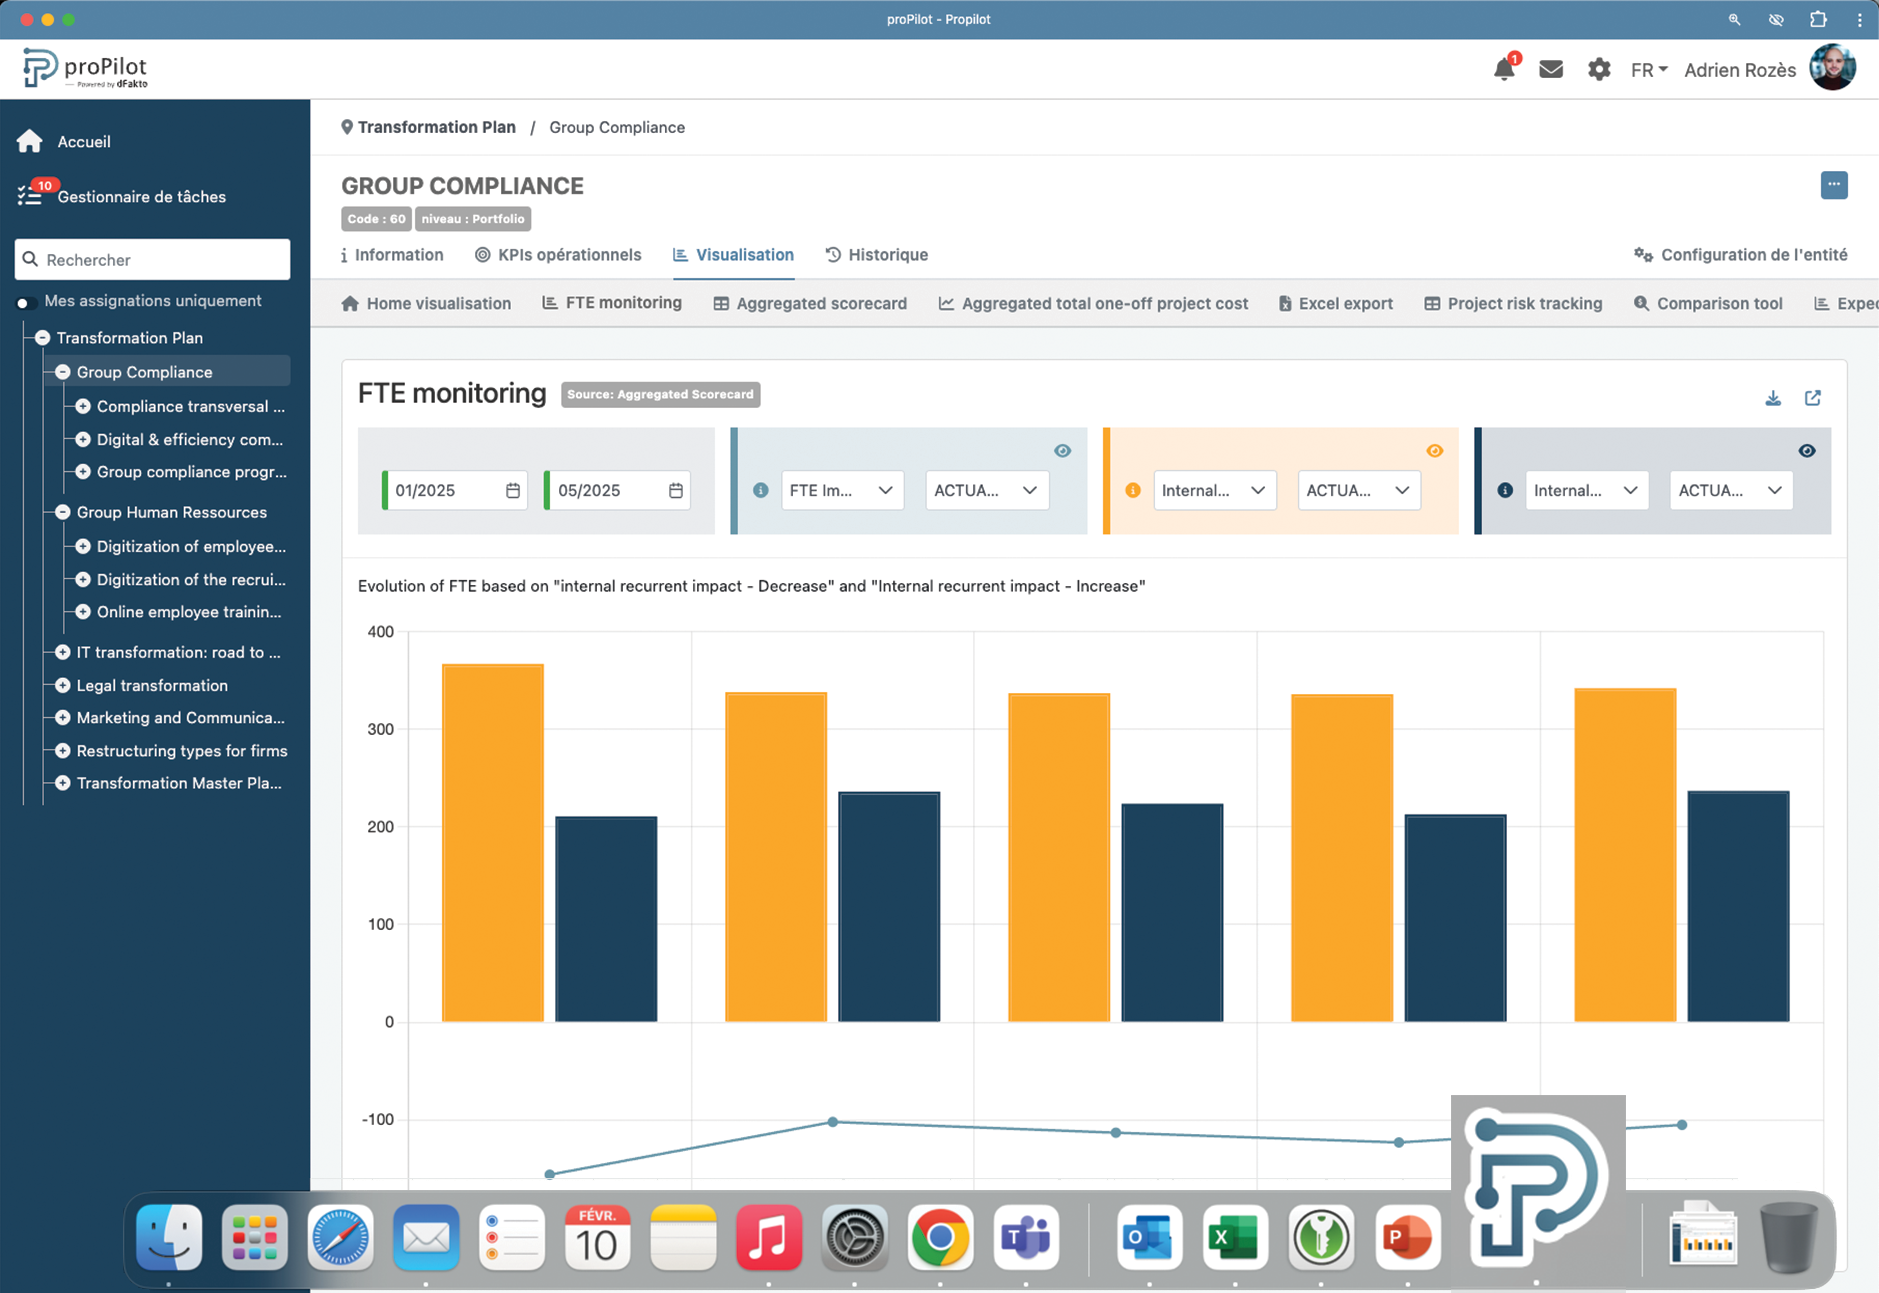
Optimize the proPilot experience by using it as an app on your computer.
proPilot is now available as an app that can be installed with a single click from your browser. Access proPilot anytime from you computer app bar and enjoy a smoother, more immersive, and engaging experience
To install proPilot as an app, please follow the guide: “Use proPilot as an application from your computer”

There are many changes... Multiple improvements are made with each version upgrade!
Improved Export Tool: The export of comparison tool results now only includes the scope defined by the user’s filters.
Optimized Multi-Choice List Display: The display of information for multiple-choice lists has been refined.
